Categories
Big Data Business Intelligence Data Analytics

Continuous Intelligence: Continuous Pros or Cons?

With available data in the modern world emerging on a second-by-second basis, one of the most prominent areas of interest for organizations is the creation of continuous intelligence. A report from Gartner indicates that by 2022 more than half of all major business systems will employ continuous intelligence in their operations.

While this sounds like an exciting opportunity for any data-centric enterprise, you might wonder, though, what the pros and cons of utilizing continuous intelligence may be. Let’s break our analysis down along those lines to examine how a business might employ this emerging technology.

What Are the Pros of Using Continuous Intelligence?

By far the biggest pro of collecting and developing business intelligence continuously is greater opportunity. A company will have the opportunity to:

  • Constantly monitor developments
  • Stay ahead of less agile competitors
  • Look at issues with the most contemporaneous data possible
  • Produce analytics and work products on an on-demand basis

Consider how a bank might approach the use of continuous intelligence to handle fraud detection. As information about transactions flows in, the bank’s analysis operations would continuously stream data to machine learning algorithms. More importantly, as bad actors try to sneak around existing filters by adapting their tactics, the fraud detection system will note the tactical changes and adjust accordingly. Rather than waiting for customers to complain or relying on filters that can only be adapted sporadically, the bank will have a constantly evolving response to constantly evolving threats.

Enhanced predictability is also a major pro for continuous intelligence. A seaborne oil transportation business, for example, might use continuous monitoring of local news and social media feeds to detect upticks in pirate activity before tankers move into more dangerous regions. Decision-makers could be delivered a list of options that might include things like routing changes in response to threats, flying in additional security personnel, or notifying police and military forces in the area.

Optimization is a big opportunity for continuous intelligence. Global supply chains have come under increasing strains in recent years. Continuous intelligence systems can scan data regarding demand, supply, geopolitical activity, macroeconomic trends, and news reports to distill what the state of the market is. Rather than waiting for shelves to be empty or warehouses to be overflowing, the company could adapt in real-time to ensure goods are sufficiently meeting needs.

What Are the Cons of Using Continuous Intelligence?

The volume of data to be analyzed poses several potential hazards to organizations that depend on continuous intelligence. In particular, there’s a danger that voluminous data will create conditions where noise starts to look like a pattern. Quality control is a significant job when using continuous intelligence as a decision-making tool, and it’s critical to employ data scientists who understand the importance of always questioning the inputs and outputs.

Common human errors in handling analytics can creep in as well. With a continuous intelligence system constantly supplying insights, it’s easy to fall into the trap of treating the machine like it’s an oracle.

Additionally, dirty data is also a huge problem. If a system is feasting on continuous inputs, it can be hard to perform the necessary amount of quality control. Consider what happens if a data vendor changes the formatting of their XML documents. If the changes are implemented without notice, there’s a real risk that the continuous intelligence system will keep humming along while generating ill-informed insights.

How to Put Continuous Intelligence to Work

The adoption of continuous intelligence tools is a fact of the business world. If you want to dive into using it, it’s worth noting that you should already have a mature data operation in place. A firm that isn’t already generating numerous business intelligence insights should ease into continuous models due to the many real-time complexities involved.

Big Data capacity has to be built out in a way that exceeds what many operations currently use to produce BI. A company has to create an operating environment where bandwidth, connection speeds, and hardware are sufficient to sustain continuous data collection. For an enterprise that already has a robust Big Data department, though, continuous intelligence represents a chance to take their game to the next level.

Back to blog homepage

Categories
Big Data

The 5 Classic Excel Tricks Every Analyst Should Know

While numerous analytics and business intelligence packages now dot the landscape, for many people Excel remains their weapon of choice when it comes to data analysis. Working in Excel means more than just reading through a spreadsheet. Excel is a powerful system in its own right, and every analyst should know the following 5 tricks that will allow them to get the most out of their work.

1. Data Cleaning in Excel

One of the most important jobs when looking at a spreadsheet is data cleaning. Fortunately, there are several built-in solutions for data cleaning in Excel.

Before you can get any work done, you’ll want to make sure the cells are properly formatted. To accomplish this, you can use the conversion tools that are available when you right-click on any cell. This gives you a slew of options, but the two big ones are:

  • Number stored as text
  • Convert to number

Respectively, those two allow you to either treat a number as text or to make sure a cell with numbers in it can be read as a number. Especially if you’ve imported something in scientific notation, this can simplify a typically painstaking task.

2. PivotTable and Unpivot

When it comes to data analysis Excel issues, the simplest methods are often the best ones. Few are quite as good as using PivotTable and Unpivot, operations that are two sides of the same coin. 

Suppose you have a table of data that needs to be condensed into a simpler second table. For example, you might want to tally all of your social media visitors by region. With a column labeled “region” in the original context, PivotTable will create a second table that condenses the work. If you need to accomplish the reverse, simply use Unpivot.

3. INDEX and MATCH

Finding a specific entry can be a genuine pain, especially if you’re dealing with rows and columns that are inconsistent. INDEX and MATCH are the tools that allow you to specify relationships between cells as a way to track down which ones you want. For example =INDEX(B6:O6, 3) will give you the entry in cell D6. It might not seem like a big deal when you first hear about it, but INDEX can massively reduce headaches when dealing with tables that are constantly changing.

MATCH is much easier to understand. If you need to find, for example, the February entry in a set of columns, =MATCH(“Feb”, B6:Z6, 0) will hunt down the right match from the range of cells provided.

4. SUMIF and COUNTIF

The SUM and COUNT tools are among the first weapons analysts tend to learn when using Excel. You can take them to the next level by using the IF versions. For example, SUMIF will only sum the values if the condition included is present. This allows you to tally up entries only if they meet specific criteria that exist. It’s also possible to go one level higher and use the SUMIFS syntax to set more criteria and look at multiple ranges.

5. VLOOKUP

Hunting through giant spreadsheets can cross a line at which it ceases to be humanly possible. A lot of people end up either using massive chains of entries, or they might even break out VBA to do the job programmatically.

This is where VLOOKUP enters the game because programmatic solutions are rarely necessary for Excel. It’s a fairly straightforward tool that operates as =VLOOKUP(target, table, index). Whatever you want to look up is the target, and the table is what you mean to search. The index informs Excel which column will be searched, with the first column starting at one.

Back to blog homepage

Categories
Artificial Intelligence Big Data

AI vs. Automation: Key Differences & Operational Impacts

One of the biggest challenges for companies trying to utilize big data, statistics, and programming capabilities is to use those tools effectively. In particular, there can be immense misunderstandings about how AI and automation work. The differences aren’t always readily apparent, but there are real operational impacts that come from knowing which jobs are meant for AI and which ones are better handled with automation.

What is Automation?

In the simplest form, there is the question of independence that distinguishes AI from automation. Programmable automated systems have existed for centuries, with the first re-programmable machines coming into operation in the weaving industry in 1801. The Jacquard loom automated processes by way of punch cards defined desirable patterns.

No one would confuse the Jacquard loom with anything approaching AI. Instead, the looms were automated by using a series of pre-defined patterns. A machine would read the holes punched into the card, and this triggered a series of tasks. In other words, automation is very good at doing jobs quickly and repeatedly.

How is AI Different from Automation?

Most forms of AI use statistical models to derive inferences from large data sets. Notably, this work often requires continuous adaptation as circumstances change.

For example, take how a spam filter might use AI to keep up with evolving techniques used by scammers. A spam filter might use some combination of techniques, many that are very time-consuming to execute, such as:

  • Word cloud analysis
  • Bayesian inference
  • Seq2Seq correlations
  • Neural networks
  • Sentiment analysis
  • Scoring

Every day, the filter is going to attain some level of success or failure. As end-users mark different emails in their inbox as spam, the AI powering the filter will run a new analysis to adapt.

It’s worth noting that this form of AI is playing against many intelligent opponents. In fact, nothing prevents spammers from using their own AI systems to assess their success and build more suitable emails. This means the AI has to go back to the lab every day to update its analysis of which emails should be let through and which ones need to be flagged.

They Are Not Mutually Exclusive

You should consider that, in many cases, there isn’t an inherent mutual exclusivity between AI and automation. Many AI functions are automated. In the previous example of a spam filter, most people running email servers will have some sort of cron job set up to trigger the next run of the AI’s analysis.

The flow of information can go the other way, too. A set of IoT sensors in a cornfield, for example, might collect data and send it to a central AI. Upon receipt of the new data, the AI goes to work analyzing it and producing insights.

Additionally, a self-perpetuating loop can also be created. The AI might send a fresh clone of a neural network to an edge device each day. Upon completion of its tasks, the edge device then ships relevant data back to the AI. The AI conducts new analysis, creates another neural network, and ships yet another clone of the NN downstream to the edge device. Rinse and repeat in perpetuity.

What Are the Operational Impacts?

A report from 2018 indicated that companies who achieved 20% or greater growth were functioning at 61% automation across their operations. Those producing less growth had only automated 35%. 

Companies are also achieving significant improvements using AI. For example, 80% of customer support queries can now be handled solely by high-quality AI-based chatbots. This means human operators can focus their energy on the challenging cases that make up the other 20%, leading to greater attention to queries and improved customer satisfaction.

To say AI and automation are transformative for businesses is an understatement. Increasingly, the winners in the business world are those enterprises that can leverage both tools. Operations that haven’t automated need to get started yesterday, and the ones that are already invested need to keep pushing the envelope to stay competitive.

Back to blog homepage

Categories
BI Best Practices Big Data

7 Best Practices for Effective Data Management

One of the biggest challenges in data management is focusing on how you can make the most of your existing resources. A common solution tossed out as an answer is to implement best practices. What exactly does it take to turn that suggestion into action, though? Here are 7 of the best practices you can use to achieve more effective data management.

1. Know How to Put Quality First

Data quality is one of the lowest hanging fruits in this field. If the quality of your data is held to high standards right from the moment it is acquired, you’ll have less overhead invested in managing it. People won’t have to sort out problems, and they’ll be able to identify useful sources of data when they look into the data lake.

Quality standards can be enforced in a number of ways. Foremost, data scientists should scrub all inbound data and make sure it’s properly formatted for later use. Secondly, redundant sources should be consolidated. You’ll also want to perform reviews of datasets to ensure quality control is in play at all times.

2. Simplify Access

If it’s hard to navigate the system, you’re going to have data management issues. Restrictive policies should be reserved for datasets that deserve that type of treatment due to privacy or compliance concerns. Don’t employ blanket policies that compel users to be in constant contact with admins to get access to mundane datasets.

3. Configure a Robust and Resilient Backup and Recovery System

Nothing could be worse for your data management efforts than watching everything instantly disappear. To keep your data from disappearing into the ether, you need to have a robust solution in place. For example, it would be wise to use local systems for backups while also having automated uploads of files to the cloud.

Right down to the hardware you employ, you should care about resilience, too. If you’re not using RAID arrays on all local machines, include desktops and workstations, start making use of them. 

It’s also wise to have versioning software running. This will make sure that all backup files aren’t just there, but that they’ll point you toward what versions of the files they correspond to. You don’t want to be using portions from version 2.5 of a project when you’re working on version 4.1.

4. Security

Just as it’s important to have everything backed up, everything should also be secure. Monitor your networks to determine if systems are being probed. Likewise, set the monitoring software up to send you notifications for things like volume spikes and unusual activity. If an intrusion occurs, you want to be sent a warning that can’t be ignored even at 3 a.m.

5. Know When to Stop Expanding Efforts

Encouraging sprawl is one of the easiest traps you can fall into when it comes to data management. After all, we live in a world where there is just so much data begging to be analyzed. You can’t download it all. If you think something might be interesting for use down the road, try to save it in an idea file that includes things like URLs, licensing concerns, pricing, and details on who owns the data.

6. Think About Why You’re Using Certain Techniques

The best of operations frequently fail to adapt because they see that things are still working well enough. If the thesis for using a particular technique for analysis has changed, you should think about what comes next. Study industry news and feeds from experts to see if you’re missing big developments in the field. Conduct regular reviews to determine if there might be a more efficient or effective way to get the same job done.

7. Documentation

Someone someday is going to be looking at a file they’ve never seen before. Without sufficient accompanying documentation, they’re going to wonder what exactly the file is and the purpose behind it. Include the basic thoughts that drove you to acquire each dataset. Remember, the person someday looking at your work and wondering what’s going on with it might be you.

Back to blog hepage

Categories
Big Data Data Analytics

Talent Analytics: Increasing the ROI of Human Capital

In every business, acquiring the right talent has always been a priority. For many years, getting the right people was treated as an art form or a talent in its own right. Good money has been made recruiting human capital, and professionals from HR pros to independent headhunters have earned reputations for matching the right talent with the right companies.

Fast forward to the 21st Century, though, and you’ve entered the age of Big Data and analytics. The data science world has taken its crack at producing the best ROI of human capital, and the resulting field of study data scientists have created has come to be known as talent analytics. Let’s take a look at what talent analytics is, why it’s important to companies, and how they can use it to improve their operations.

What Is Talent Analytics?

A central tenet of analytics is a belief that most problems can be quantified. This presumes you have access to sufficient data and can identify the right metrics. Notably, a branch of analytics is dedicated to ranking which metrics are most worthwhile.

Data scientists see talent assessment no differently than other fields to be analyzed. If anything, the robust amount of information about hiring, retention rates, firing, and skills that most companies have developed makes it a field that’s ready for exploitation. Organizations can acquire relevant data from many sources, including:

  • Entrance and exit interviews
  • Performance reports
  • Personnel files
  • Education histories
  • Applications

Suppose you want to figure out which team members should be considered for leadership positions and placed on career tracks for management. In the past, a fairly biased process was used, usually recommendations from other managers. With talent analytics, you can review metrics that are tied to top-tier performance in leadership roles to assess which team members have an affinity for management.

Why Is This Important to Companies?

Placing the wrong person in a position can lead to problems that echo throughout a company. If you have a management role that strongly influences your newest hires, for example, that leadership position, if poorly, filled can do years worth of damage by leaving a negative imprint on newly acquired talent. Putting time, money, and work into identifying the right people for key roles doesn’t just influence the success of one person in one position. It can influence how people who work under them pursue their careers, feel about the industry, and choose to chart their career paths.

How Talent Analytics Improves Operations

To optimize your workforce, you need to develop metrics for a host of talent measures. You might establish metrics to assess things like:

  • Leadership skills
  • Company loyalty
  • Interpersonal abilities
  • Communication skills
  • Performance on a per-dollar and -hour basis

Suppose your company is downsizing to deal with adverse macroeconomic conditions. You need to hold onto the right combination of team members who’ll provide you the most value for every dollar you’re going to spend on salary. On a position-by-position basis, you can determine which employees are going to represent the most value with what you can spend. This will ensure your company will operate as effectively as possible while riding out the downturn, leaving you in the best possible cash position during tough times.

Even in good times, this approach can be useful. You might see your firm is having trouble with the retention of skilled workers in a competitive labor market. By scanning through exit interviews and worksheets, you can produce a relevant data set. This data can then be used to identify the factors behind why workers leave and what could be done to retain the best talent at your company.

Conclusion

In nearly every business, putting together the best talent is a winning play. Getting there in an objective manner, though, can be a challenge. A good talent analytics system can go a long way toward helping you hire, retain, and promote the best people.

Back to blog homepage

Categories
Big Data Data Analytics

The Beginner’s Guide to Creating Data-Driven Marketing Content

For many companies, multiple core business functions and departments are moving towards becoming data-driven. One area that’s often lagging, especially outside of the core publishing world, is the production of marketing content. You’re likely doing marketing on several platforms, and that means there is a ton of data waiting to be put to work. Let’s take a look at what data-driven marketing content is and how you can begin making use of it.

What is Data-Driven Content?

To clarify, data-driven marketing content isn’t content that uses data as a topic or employs data in the content itself. While these are valid ways to use your data, it’s not the point here.

Instead, data-driven content is what comes from scanning data for clues about:

  • Why people click on headlines
  • Which topics resonate with your audience
  • How people are finding your content
  • What motivates them to take additional actions
  • Who your best content producers are
  • What drives search-based click-thrus

Someone running a non-profit advocacy group, for example, needs to be able to draw a line from their marketing content to the actions they want visitors to take. Such actions may include:

  • Signing up for the mailing list
  • Following your social media feeds
  • Sharing your message with others
  • Contacting you so they can learn how to help
  • Asking for your assistance

Where Data Fits In

In the previous example of an advocacy group, the hypothetical organization is trying to build what is fundamentally a marketing funnel. Traditionally, lots of people have guessed as to how to produce marketing content for such purposes. Some have earned reputations as gifted copywriters who are experts in knowing what drives traffic.

By moving to a data-driven approach, you’re eliminating the guesswork and biases. Analytics packages will collect data from a host of sources, such as social media feeds, emails, and website logs. You can then study how visitors go from learning about your messages, services, and products to taking desired actions. Likewise, you can establish where visitors who don’t get to the end of the funnel are falling off.

Tips for Using Data-Driven Marketing Content

Generating the data that drives your decisions about your marketing content is the entire endgame. In the simplest form, you can look at simple correlations between visits and headlines, for example. Good data scientists, though, know that correlation can be spurious and there are plenty of other ways to derive better insights. Let’s take a look at a few.

Latent Semantics

An old school keyword analysis is on the decline, and it has largely been replaced by latent semantic analysis. Some topics and words appear in very specific contexts, and this is especially the case with certain clusters of ideas. For example, the word “hot” has a very different latent semantic value when coupled with the word “car” as opposed to words such as “food” or “celebrities.” 

A/B Testing

There’s no reason to take only a passive approach when collecting data. You can also produce two versions of the content. As people click on the A or B version more often, you can discern which drives interest. Similarly, you can put together the cumulative insights from all of your A/B tests to get much deeper perspectives.

Surveys

Sometimes the simplest way to get answers is to ask your ideal customers a question. For example, you can have a poll pop up when someone goes to leave your website after only being on it for a couple of minutes or less. The poll might ask them why they’re leaving. This can help you determine if they’re leaving your site because they are frustrated or if they have found what they needed.

Targeting with Personas

Grouping like-minded audience members together is a great way to improve your targeting efforts. A fashion brand might find, for example, that it’s seeing very different responses from under-40 buyers versus the 41+ demo. By developing personas for each group, you can then deliver content that matches what drives their interest. Likewise, you can avoid hassling folks outside those persona categories with content that doesn’t click for them.

Conclusion

Huge amounts of data are generated every time someone clicks. It’s important to start harvesting that data so you can begin to tailor your marketing content. With time, both you and your audience will benefit from the changes.

Back to blog homepage

Categories
Big Data Business Intelligence

5 Unique Ways Companies Use Their Customer Data

A major component of the Big Data revolution at most companies has been putting customer data to work. While there’s a lot to be said for dealing with the basics, such as sales tracking and website visitor logging, you may also want to explore some of the more unique ideas that yield valuable insights. Here are 5 ways businesses are using customer data to create value.

Customer-Led Algorithms

Especially for companies that allow customers to create personalized items, a major step to consider is creating a customer-led algorithm. This entails:

  • Making customers aware of their role in shaping the algorithm
  • Providing them with the tools needed to interact efficiently with the system
  • Creating a feedback loop of customer interactions and machine learning

Suppose you run an apparel company and your online store allows customers to create individualized designs. You can use the algorithm to track a slew of different features from each sale, including colors, sizes, and materials. 

Beyond that, you can also use machine learning and vision systems to recognize designs and patterns. For example, you might spot a trend from customers who are focused on a specific set of memes. This information can then be used to create a new line of items or targeted marketing content.

Sharing Data Back to Customers

Collecting data without providing value to its originators can feel like bad form. Worse, customers often get upset when they fully comprehend just how much personal data a company such as Facebook or Twitter is using. This is seen as an act of taking without returning value.

Sharing data back to customers not only fixes the sense that companies are free riders, but it also provides a new source of content and engagement. For example, Pantone publishes two reports a year showing color trends in the fashion world, such as this one from Spring 2020. Not only does this allow Pantone to continue to assert its place as an industry leader and authority, but the reports give customers something to play with, inspire new ideas, and foster discussion.

Targeting Social Influencers

You likely already have a budget for doing social media work. A major question, however, revolves around how you can get the most bang for your buck. Many businesses use social media network graphs to identify specific influencers. Some individuals and businesses are networked to others in a way that drives opinions.

Notably, not all influencers have massive followings. Instead, the best influencers are often the folks who get the ball rolling on trending conversations. A well-designed system can identify who among your customers starts those conversations, allowing you to focus early marketing interactions with those parties. The next time you need to do a marketing roll-out, you’ll have a list of who ought to be prioritized.

Results Matching

Anyone who has used Netflix has experienced one of the more robust examples of how results can be tied to customer profiles. The streaming giant uses customer data to generate profiles, and a machine learning system regularly recompiles this information. Netflix can identify which genres people like, and it can also determine whether someone would prefer a long- or short-form program. 

This allows the company to satisfy customers based on their taste and preferences without constantly harassing them for input. A user simply logs in to the system and is presented with numerous curated suggestions for what they should consider watching.

Spotting Customer Problems

Many companies lose customers due to a negative experience without first giving the firm a chance to improve or resolve the issue. Analyzing large amounts of customer data can provide insights about when customers are at the brink of leaving. Customer service professionals can then touch base with these individuals to learn about their situation. 

If there is a specific problem that hasn’t been addressed, it can be flagged and fixed. You can also use this data to structure incentives aimed at keeping the customer on board.

Conclusion

It’s important to see customer data as more than just sales numbers and web traffic. Every piece of customer data is an opportunity to return value to individual consumer and the larger public. Bringing an adventurous approach to dealing with customer data can significantly differentiate your business from competitors as well as improve existing operations.

Back to blog homepage

Categories
Big Data Business Intelligence

Big Data Time Killers That Could Be Costing You

Putting big data systems to work across varying companies and industries all have one thing in common, almost all forms of big data work end up being time-demanding. This cuts into productivity in many ways, with the most obvious being that less time can be allocated towards analysis.

To address the problem, the first step is to identify the varieties of time killers that often occur during these projects. Let’s take a look at four of the most significant as well as solutions to avoid them.

Data Acquisition and Preparation

One of the most easily recognized time killers is the effort that goes into simply collecting data and preparing it for use. This occurs for a host of reasons, including:

  • Difficulty finding reliable sources
  • Inability to license data
  • Poorly formatted information
  • The need for redundancies in checking the data
  • The processing time required to go through massive datasets

Solutions run the gamut from paying third parties for data to creating machine learning systems that can handle prep work. Every solution has an upfront cost in terms of either money or time, but the investment can pay off generously if you’re going to reuse the same systems well into the future.

Lack of Coordination

Another problem is that lack of coordination can lead to various parties within a company repeating the same efforts without knowing it. If an organization lacks a well-curated data lake, someone in another division might not realize they could have easily acquired the necessary information from an existing source. Not only does this cost time, but it can become expensive as storage requirements are needlessly doubled.

Similarly, people often forget to contribute to archives and data lakes when they wrap projects up. You can have the most advanced system in the world, but it means nothing if the culture in your company doesn’t emphasize the importance of cataloging datasets and making them available for future use.

Not Knowing How to Use the Analytics Tools

Even the best of data scientists will find themselves picking and sticking to get a system to work. Some of this issue is inherent to the job, as data science tends to reward curious people who are self-taught and forward-thinking. Unfortunately, this is time spent on work that a company shouldn’t be paying for.

Likewise, a lack of training can lead to inefficient practices. If you’ve ever used a computer program for years only to learn that there was a shortcut for doing something you had handled repeatedly over that time, you know the feeling. This wasted time adds up and can become considerable in the long run.

Here, the solution is simple. The upfront cost of training is necessary to shorten the learning curve. A company should establish standards and practices for using analytics tools, and there should be at least one person dedicated to passing on this knowledge through classes, seminars, and other training sessions.

Poorly Written Requirements for Projects

When someone sits down with the project requirements, they tend to try to gloss over the broad strokes, identify problem areas, and then get to work. A poorly written document can leave people wondering for weeks before they even figure out what’s wrong. In the best-case scenario, they come back to you and address the issue. In the worst-case scenario, they never catch the issue and it eventually ends up skewing the final work product.

 Requirements should include specifics like:

  • Which tools should be used
  • Preferred data sources
  • Limits on the scope of analysis
  • Details regarding must-have features

It’s always better to go overboard with instructions and requirements than to not provide enough specifics.

Conclusion

It’s easy during a big data project to get focused on collecting sources, processing data, and producing analysis. How you and your team members go about doing these things is, though, just as important as handling them. Every business should have processes in place for weeding out the time killers in projects and ultimately making them more streamlined. This may include project reviews such as when team members are prompted to state what issues they encountered. By taking this approach, you can reduce the amount of time spent on mundane tasks and increase the amount of work that goes into analysis and reporting.

Back to blog homepage

Categories
Big Data Business Intelligence Data Analytics

7 Steps to Start Thinking Like a Data Scientist

Having the skills needed to perform data science work is immensely beneficial in a wide range of industries and job functions. But at some point, it is also advantageous to develop a thought process that allows you to tackle problems like a data scientist. Here are 7 steps you can take to start thinking like one.

1. Understand How the Project Lifecycle Works

Every project needs to be guided through a lifecycle that goes from preparation to building and then on to finishing it. Preparation means setting goals, exploring the available data, and assessing how you’ll do the job. Building requires planning, analyzing problems, optimizing your approach, and then building viable code. Finally, finishing requires you to perform revisions, deliver the project, and wrap up loose ends. The lifecycle installs rails around the project to ensure it doesn’t suffer from mission creep.

2. Know How Time Factors into Cost-Benefit Analysis

Scraping the web for all the data you need may prove to be time-consuming, especially if the data needs to be aggressively cleaned up. On the other hand, purchasing data from a vendor can be expensive in terms of capital. There’s rarely a perfect balance between time and money so try to be receptive to which is more important on a particular project.

3. Know Why You’ve Chosen a Specific Programming Language

All programming languages have their unique strengths and weaknesses. For example, MATLAB is a very powerful language, but it often comes with licensing issues. Java handles work with a high level of precision, but it can be cumbersome. R is an excellent choice for people who need core math functions, but it can be limiting when it comes to more advanced functionality. It is essential to think about how your choice of a programming language will influence the outcome of your project.

4. Learn How to Think Outside of Your Segment of Data Science

 It’s easy to get caught in the trap of thinking certain processes are somehow more academically valid than ones aimed at the consumer market or vice versa. While something like A/B testing can feel very simple and grounded in the consumer sector, it may have applications to projects that are seemingly more technically advanced. Be open-minded in digesting information from sectors that are different from your own.

5. Appreciate Why Convincing Others is Important

Another common trap in data science is to just stay in your lane. Being a zealous advocate for your projects can make a difference in terms of getting approval and resources for them.

Develop relationships that encourage the two-way transmission of ideas and arguments. If you’re in a leadership position at a company, foster conversations with individuals who are closer to where the data gets fed into the meat grinder of analysis. Likewise, those down the ladder should be confident in presenting their ideas to people further up the chain. A good project deserves a representative who’ll advocate for it.

6. Demand Clean Data at Every Stage of a Project

Especially when there’s pressure to deliver work products, cleaning up data can sometimes feel like a secondary concern. Oftentimes, data scientists get their inputs and outputs cleaned up to a condition of “good enough” to avoid additional mundane cleaning tasks.

Data sets rarely just go away when a job is done, and that’s simply good practice for the sake of retention, auditing, and reuse. But, that also means someone else may get stuck swimming through a data swamp when they were expecting a data lake. Leave every bit of data you encounter looking cleaner than you found it.

7. Know When to Apply Critical Thinking

Data science should never be a machine that continually goes through the motions and automatically spits out results. A slew of problems can emerge when a project is too results-oriented without an eye toward critical thinking. You should always be thinking about issues like:

  • Overfitting
  • Correlation vs. causation
  • Bayesian inference
  • Getting fooled by noise
  • Independent replication of results

Welcome criticism and be prepared to ask others to show how they’ve applied critical thinking to their efforts. Doing so could very well save a project from a massive misstep.

Back to blog homepage

Categories
Big Data Business Intelligence Data Analytics

Top 5 Critical Big Data Project Mistakes to Avoid

Going to work on a big data project can leave you wondering whether your organization is handling the job as effectively as possible. It’s wise to learn from some of the most common mistakes people make on these projects. Let’s look at 5 critical big data project mistakes and how you can avoid them.

Not Knowing How to Match Tools to Tasks

It’s tempting to want to deploy the most powerful resources available. This, however, can be problematic for a host of reasons. The potential mismatch between your team members’ skills and the tools you’re asking them to use is the most critical. For example, you don’t want to have your top business analyst struggling to figure out how to modify Python code.

The goal should always be to simplify projects by providing tools that match their skills well. If a learning curve is required, you’d much prefer to have non-technical analysts trying to figure out how to use a simpler tool. For example, if the only programming language choices are between Python and R, there’s no question you want the less technically inclined folks working with R.

Failing to Emphasize Data Quality

Nothing can wreck a big data project as quickly as poor quality. The worst of possible scenarios is that low-quality and poorly structured data is fed into the system at the collection phase, ends up being used to produce analysis, and makes its way into insights and visualizations. 

There’s no such thing as being too thorough in filtering quality issues at every stage. You’ll need to keep an eye out for problems like:

  • Misaligned columns and rows in sources
  • Characters that were either scrubbed or altered during processing
  • Out-of-date data that needs to be fetched again
  • Poorly sourced data from unreliable vendors
  • Data used outside of acceptable licensing terms

Data Collection without Real Analysis

It’s easy to assemble a collection of data without really putting it to work. A company can accumulate a fair amount of useful data without doing analysis, after all. For example, there is usually some value in collecting customer service data even if you never run a serious analysis on it.

 If you don’t emphasize doing analysis, delivering sights and driving decision-making, though, you’re failing to capitalize on every available ounce of value from your data. You should be looking for:

  • Patterns within the data
  • Ways to benefit the end customer
  • Insights to provide to decision-makers
  • Suggestions that can be passed along

Most companies have logs of the activities of all of the users who visit their websites. Generally, these are only utilized to deal with security and performance problems after the fact. You can, however, use weblogs to identify UX failures, SEO problems, and response rates for email and social media marketing efforts.

Not Understanding How or Why to Use Metrics

The analysis necessarily noteworthy if it’s not tied to a set of meaningful and valuable metrics. In fact, you may need to run an analysis on the data you have available just to establish what your KPIs are. Fortunately, some tools can provide confidence intervals regarding which relationships in datasets are most likely to be relevant.

For example, a company may be looking at the daily unique users for a mobile app. Unfortunately, that company might end up missing unprincipled or inaccurate activity that causes inflation in those figures. It’s important in such a situation to look at metrics that draw straight lines to meaningful performance. Even if the numbers are legit, having a bunch of unprofitable users burning through your bandwidth is not contributing to the bottom line.

Underutilizing Automation

One of the best ways to recoup some of your team’s valuable time is to automate as much of the process as possible. While the machines will always require human supervision, you don’t want to see professionals spending large amounts of time handling mundane tasks like fetching and formatting data. Fortunately, machine learning tools can be quickly trained to handle jobs like formatting collected data. If at all possible, find a way to automate the time and attention intensive phases of projects.

Back to blog homepage

Polk County Schools Case Study in Data Analytics

We’ll send it to your inbox immediately!

Polk County Case Study for Data Analytics Inzata Platform in School Districts

Get Your Guide

We’ll send it to your inbox immediately!

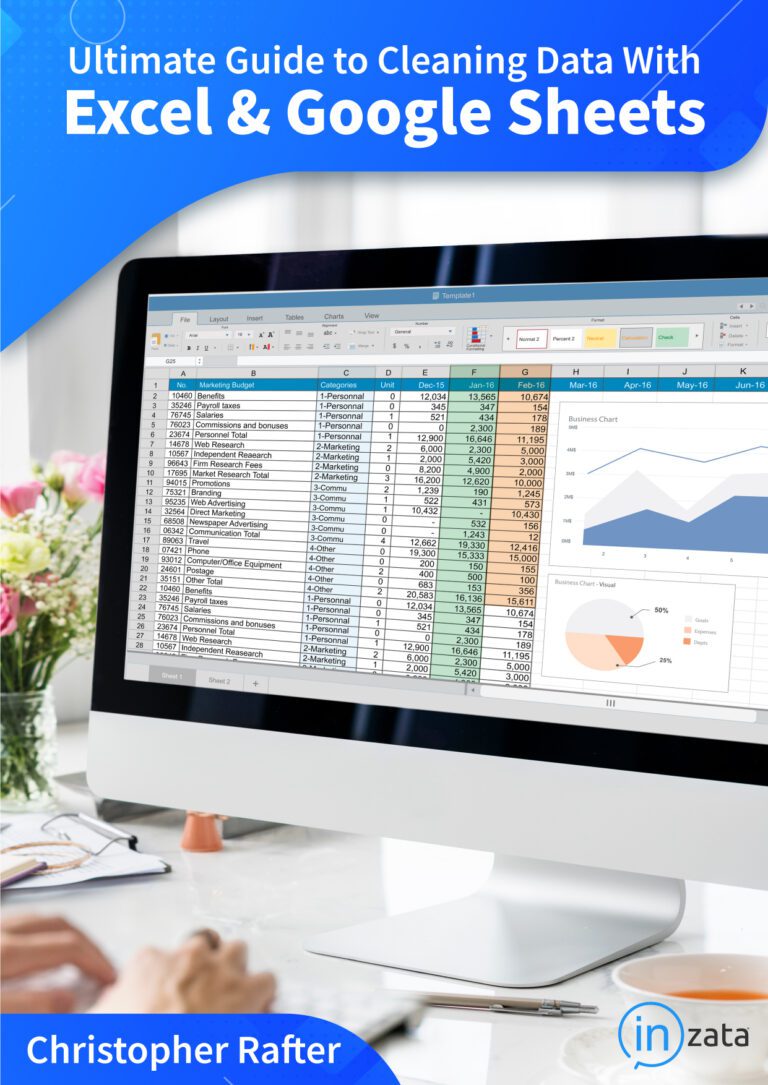
Guide to Cleaning Data with Excel & Google Sheets Book Cover by Inzata COO Christopher Rafter