Categories
Data Analytics Data Modeling

Disparate Data: The Silent Business Killer

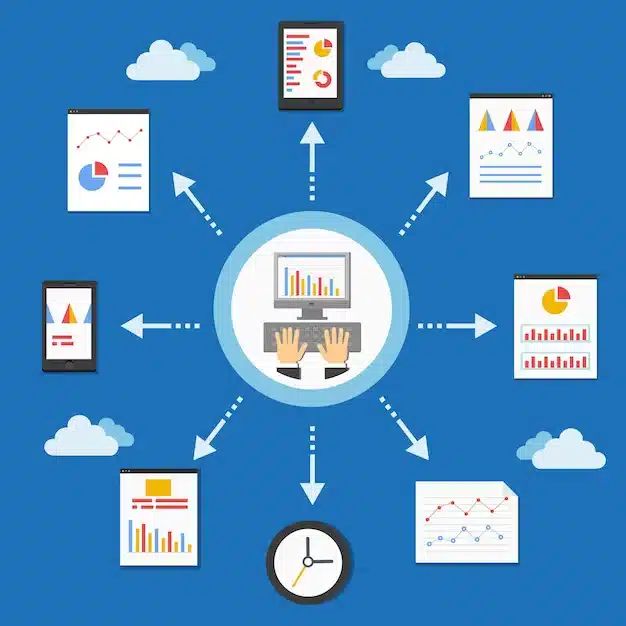
Data can end up in disparate spots for a variety of reasons. Deliberate actions can be taken in the interest of not leaving all your eggs in one basket. Some organizations end up in a sort of data drift, rolling out servers and databases for different projects until each bit of data is its own island in a massive archipelago.

Regardless of how things got this way at your operation, there are a number of dangers and challenges to this sort of setup. Let’s take a look at why disparate data can end up being a business killer.

Multiple Points of Failure

At first blush, this can seem like a pro. The reality, however, is that cloud computing and cluster servers have made it possible to keep your data in a single pool while not leaving it subject to multiple points of failure.

Leaving your data in disparate servers poses a number of problems. First, there’s a risk that the failure of any one system might wipe information out for good. Second, it can be difficult to collect data from all of the available sources unless you have them accurately mapped out. Finally, you may end up with idle resources operating and wasting energy long after they’ve outlived their utility.

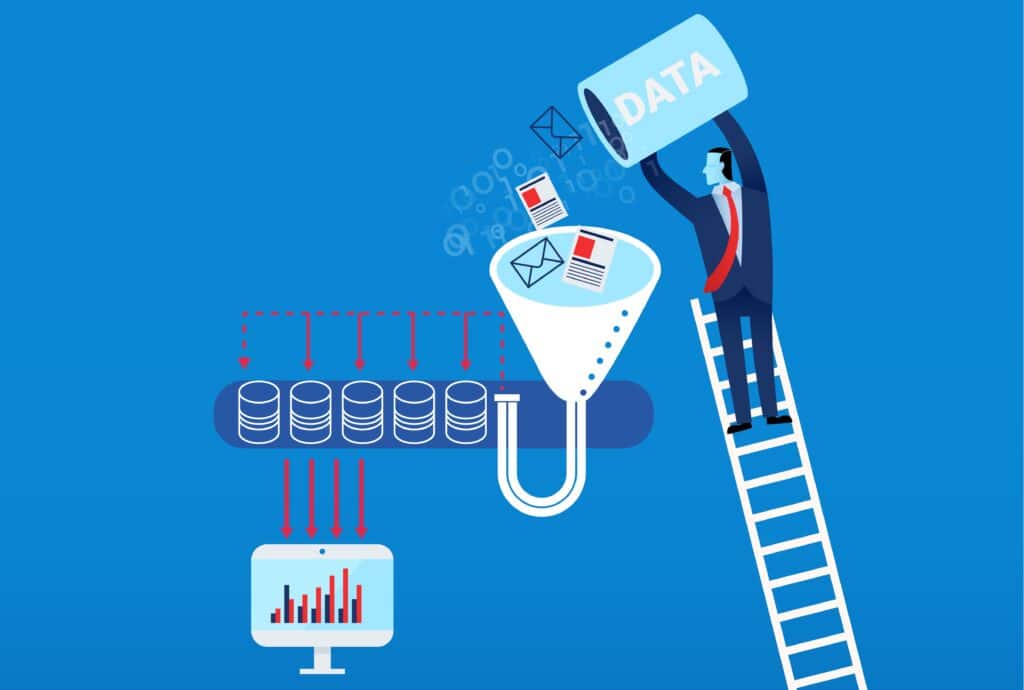
It’s best to get everything onto a single system. If you want some degree of failure tolerance beyond using clouds or clusters, you can set up a separate archive to store data at specific stages of projects. Once your systems are brought up to speed, you’ll also begin to see significant cost savings as old or excess servers go offline.

Inconsistency

With data spread out across multiple systems, there’s a real risk that things won’t be properly synchronized. At best this ends up being inefficient. At worst it may lead to errors getting into your finished work products. For example, an older dataset from the wrong server might end up used by your analytics packages. Without the right checks in place, the data could be analyzed and out into reports, producing flawed business intelligence and decision-making.

Likewise, disparate data can lead to inconsistency in situations where multiple teams are working. One group may have its own datasets that don’t line up with what another team is using. By centralizing your efforts, you can guarantee that all teams will be working with the same data.

Bear in mind that inconsistency can get very far out of hand. If you need to audit data for legal purposes, for example, you may find data that has been retained too long, poorly anonymized or misused. With everything centralized, you’ll have a better chance of catching such problems before they create trouble.

Security Risks

More systems means more targets. That opens you up to more potential spots where hackers might get their hands on sensitive data. Similarly, you’re stuck with the challenge of patching multiple servers when exploits are found. In the worst scenario, you may not even notice a breach because you’re trying to juggle too many balls at the same time. Simply put, it’s a lot of work just to end up doing things the wrong way.

Turf Wars and Company Culture

When different departments in control of different data silos, it’s likely that different groups will start to see the data within their control as privileged. It’s rare that such an attitude is beneficial in a company that’s trying to develop a data-centric culture. Although you’ll want access to be limited to appropriate parties, there’s a big difference between doing that in a structured and well-administrated manner versus having it as the de facto reality of a fractured infrastructure.

Depending on how culturally far apart the departments in a company are, these clashes in culture can create major friction. One department may have an entirely different set of security tools. This can make it difficult to get threat monitor onto a single, network-wide system that protects everyone.

Conflicts between interfaces can also make it difficult for folks to share. By building a single data pool, you can ensure greater interoperability between departments.

Conclusion

Consolidating your data systems allows you to create a tighter and more efficient operation. Security can be improved rapidly, and monitoring of a single collection of data will allow you to devote more resources to the task. A unified data pool can also foster the right culture in a company. It takes an investment of time and effort to get the disparate data systems under control, but the payoff is worth it.

Back to blog homepage

Categories
Big Data Data Analytics

Prescriptive Analytics: The Ultimate Purpose of Your Data

  • Descriptive
  • Predictive
  • Prescriptive

When we think about answering the question of what an organization should do, that brings us into the domain of prescriptive analytics. Let’s take a look at what the world of prescriptive analytics is all about and how it can benefit your operation.

Prescriptive Analytics Compared to Other Methods

One way to understand what a prescriptive approach actually involves comparing it to other forms of business analytics. Descriptive analytics helps us get a handle on what a problem looks like now and what it looked like in the past. In particular, it generally does not attempt to address questions about causal relationships. The goal, instead, is simply to lay the bag of snakes out straight.

For example, historical economic analysis is a form of descriptive analytics. An economist looking back at data regarding the Tulip Mania during the 1600s probably isn’t trying to create a model for how bubbles form in the modern economy.

The world of predictive analytics is at the opposite end of the scale. Researchers there are trying to examine current data and trends in order to determine where things will land in the future. For example, a report on the global impact of climate change might be intended to just figure out what the heck is on the horizon.

Prescriptive Analytics

Prescriptive analytics cuts to the core of three questions:

  • What can we do?
  • What should we do?
  • What might others do?

The oil and gas industries are big spenders on prescriptive analytics. Exploring regions for oil, for example, opens up questions that go well beyond what descriptive or predictive analytics can do. An oil company does need to take a descriptive view of a deposit, and it does need to predict things like global demand and supply trends. When drilling a well, an oil company has to prescribe solutions to problems like:

  • Boring through rock
  • Fluid and gas pressures in deposits
  • Where to position rigs
  • How many workers to assign to projects

These kinds of business analytics are meant to assess risks, exploit opportunities and maximize returns. A state government might, for example, want to know at what grade level it should spend the most money to ensure that economically disadvantaged kids can get ahead. To do this, they have to figure out where the risks to those kids arise and what opportunities aren’t being presently exploited.

Conclusion

For many organizations, prescriptive analytics projects represent their goals. Decision-makers are empowered to take action when prescriptions are grounded in hard data. Rather than producing tons of data that just goes into spreadsheets and databases never to be read, organizations can convert massive amounts of information into answers to pressing questions.

Read More Here

Categories
Data Analytics

Data Analytics Improves the Most Crucial Departments of Your Business

Analytics in business is a sure-fire way to outpace your competition, delight your customers, and secure the long-term success of your organization. Business analytics helps your business in a variety of different ways. No matter how “perfect” you think your business processes are already, data analysis software and product analytics can show you new ways of thinking about things that can improve productivity, improve quality, save time, and improve customer satisfaction.

Business analytics allows you to combine all of your data from multiple sources to show trends, patterns, and relationships across your entire business. You can then take this data, learn from it, and make changes accordingly to improve different aspects of your business. By using data analytics, you can view your business from a new perspective and make changes based on statistical analysis to improve the company.

Analytics in Business: Human Resources Department

Human resources is one of the most important departments of a business, and improving the way your HR functions is a great way to benefit your business. Big data can allow your HR department to view multiple datasets of how employees are doing with their work, allowing them to make changes accordingly to benefit everyone. Some examples of the types of data that are helpful to human resources are:

Using datasets like these, human resource departments can make changes to their processes that can improve productivity, employee satisfaction, and working conditions.

Analytics in Product Development

Product development is arguably the most important part of a business. Product analytics can help businesses improve product development by looking at the big picture, and analyzing all aspects of the current market, competitors, and the company’s own product. Companies can use product analytics to look at:


Using product analytics to improve product design and performance is guaranteed to have a huge impact on customer satisfaction and subsequently, sales in general.

Analytics in Business: Manufacturing

Manufacturing is another department that can benefit greatly from business analytics. It can be a very complicated department with lots of moving parts, and a lot of room for error, but also a lot of room for improvement. There are many aspects to producing goods that data analytics can allow you to greatly improve your processes through statistical analysis. Data analytics can improve:

Key Benefits of Data Analytics in Business

As previously stated in this article, there are many different ways that big data analytics can improve businesses, but the best data analytics platforms should provide innovation in business processes, improved customer service, and lower costs to the company. When a company utilizes big data analytics into their processes, they should receive a substantial competitive advantage over businesses that don’t use data analytics to optimize their business processes. Investing in data analytics to improve your business is one of the smartest moves you can make to improve and stay on top of the market.

Read More Here

Categories
Big Data Data Analytics

Data Quality: Making Change a Choice

In the modern world, nothing stays the same for long. We live in a state of constant change; new technologies, new trends and new risks. Yet it’s a commonly held belief that people don’t like change. Which led me to wonder, why do we persist in calling modify management initiatives “change management” if people don’t like alter.

In my experience, I have not found this maxim to be true. Actually, nobody minds change, we evolve plus adapt naturally but what we do not really like is being forced to change. As such, when we make a choice to change, it is often easy, fast and permanent.

To put that into context, change is an external force imposed upon you. For example , if I tell you I want you to change your attitude, you are expected to adapt your patterns of behaviour to comply with my idea associated with your ‘new and improved attitude’. This is difficult to maintain and conflicts with your innate human need to exercise your own free-will. However, if I ask a person to choose your own attitude, this places you in control of your personal patterns of behaviour. You can assess the particular situation and decide the appropriate attitude you will adopt. This…

Read More on Dataflow

Categories
Artificial Intelligence Big Data Data Analytics

Anomaly Detection — Another Challenge for Artificial Intelligence

It is true that the Industrial Internet of Things will change the world someday. So far, it is the abundance of data that makes the world spin faster. Piled in sometimes unmanageable datasets, big data turned from the Holy Grail into a problem pushing businesses and organizations to make faster decisions in real-time. One way to process data faster and more efficiently is to detect abnormal events, changes or shifts in datasets. Thus, anomaly detection, a technology that relies on Artificial Intelligence to identify abnormal behavior within the particular pool of collected data, has become one of the main objectives of the Industrial IoT.

Abnormality detection refers in order to the identification associated with items or occasions that do not conform to an expected pattern or to other items in a dataset that are usually undetectable by the human expert. Such anomalies can generally be translated into problems such as structural defects, errors or frauds.

Examples of potential anomalies

A leaking connection pipe that leads to the shutting down of the entire production line;
Multiple failed login attempts indicating the possibility of fishy cyber activity;
Fraud detection in financial transactions.

Why is it important?

Modern businesses are beginning to understand the particular importance of interconnected operations to get the full picture of their…

Read More on Dataflow

Categories
Data Analytics Data Visualization

4 Reasons to Utilize Data Visualization Software

The role that data analytics plays in modern business is becoming increasingly appreciated. According to one report, the per-dollar-spent ROI gained from using analytics & increased from $10.66 in 2011 to $13.01 in 2014. Working with analytics is one thing, but translating data-driven insights into useful work products is quite another. That’s where data visualization enters the picture. Data visualization is an opportunity to go beyond dumping data into an Excel spreadsheet. With the right approach, data visualizations can improve a company’s efficiency and effectiveness in the following ways.

Shorter and Better Meetings

At many organizations, analytics need to be converted into work products that are then presented to stakeholders at meetings. How you choose to go about presenting the insights you’ve gained can influence the meetings you have. Research from the American Management Association has shown that data visualizations were able to:

  • Shorten meeting times by 24%
  • Provide 43% greater effectiveness in persuading audiences
  • Bring about 21% more consensus in decision-making
  • Improve problem-solving by 19%

Simply put, coming into a meeting with effective data visualizations makes a meeting faster and more useful. Bear in mind that modern data visualization techniques can yield a lot more than just a few pie, bar and line charts. Today’s data visualization techniques include producing items like:

  • Interactive dashboards
  • Real-time updates
  • Geographic data
  • 3-D maps
  • Cloud and bubble charts
  • Tree maps

Visual Learning

Most human beings cannot listen to or read large amounts of data and readily make sense of what it really means. Human beings tend to benefit from having a sense of how things relate over time and through space, and visualization examples help. In visualization examples, an alluvial diagram of events can help people understand how one thing flows from one place to a new one.

For some sense of how visualization examples can help understanding, consider this diagram of asylum seeking in Europe. Hearing that certain groups are more likely to have their applications accepted based on their origin and destination is one thing. Conversely, being able to study a diagram that shows the flow of people and their acceptance and rejection statuses makes it easier to process the idea.

There are four core data visualization tools that can be used to represent insights. These are:

  • Color
  • Shape
  • Visual movement
  • Spatial relationships

Just being able to differentiate to color-coded data points may go a long way to increase your understanding of the meaning of a piece of research. A company’s data team might visualize questions about new and established customers, for example, by coloring new users with red dots and old users with blue dots. This can make it easier to follow along as you see how changes in the customer base have shifted over time. Compare that to trying to fish out data from a spreadsheet.

Long-Term Engagement

Particularly in the era where data visualization tools like dashboards can be made available to everyone who has a phone, tablet or laptop, there’s a lot to be said for the engagement value of data visualizations. Let’s say a CFO who was presented with a report at a meeting wants to refer back to materials from the session. Rather than having to sift through papers or ask someone to email them a particular slide, they can simply pull up the company’s data visualization tools and check the presentation there.

More importantly, increased interactivity can keep decision-makers engaged with data. Being able to click on items and see how different factors shift can improve engagement significantly. Especially when working with parties that aren’t 100% sold on your ideas, it can be helpful for them to scan and interact with data over several iterations.

People also enjoy interacting with data. Switching back and forth using the data visualization tools between an operations current-year report and one from last year, for example, can foster engagement and interest.

Promoting Culture Change

Becoming a data-centric organization requires bringing along decision-makers, employees, contractors, customers and other stakeholders. You want to onboard as many of these parties as possible as your company starts valuing data as a part of its decision-making process. Whenever possible, you also don’t want to leave people behind.

Data visualizations can help folks get onboard with a culture change that’s moving toward data and analytics. Improvements in engagement, learning and efficiency can help them feel why the culture change has to happen and how it benefits them.

Stakeholders will eventually become more proficient as they settle into patterns of using visualizations. They will come to understand and apply statistical concepts such as:

  • Regression to the mean
  • Outliers
  • Hypothesis testing
  • Statistical confidence and uncertainty

They’ll also begin to appreciate why certain data visualization techniques were employed.

Over time, analytics insights can become a product that stakeholders start to demand rather than dread seeing. People will whip out their phones and tablets to check up on the state of the company in real-time via dashboards. Instead of feeling like the culture change has been imposed upon them, they will start to see it as just something they can’t do without.

Read More Here

Categories
Big Data Data Analytics

How To Use Big Data to Improve Your Customer Service

Customer experience is everything.

Recent research has revealed that 90 percent of buyers are willing to pay a premium for better customer experience. The key is understanding what an improved experience actually means for a customer, however.

The rise associated with analytics has positioned companies to achieve closer customer analysis—on a far greater scale than feedback surveys or social media comments. With access to a mix of complex data sets from an array of sources, companies now have better insight into customer behavior, leading to higher sales numbers and better customer service.

With that will in mind, here are five ways you can use this new emphasis on information to deliver much better customer care.

1 . Know Your Target Audience Much Better

In the past, data collected on customer interactions were primarily drawn from observation and direct engagement. These sources provided some level of insight but were difficult to aggregate—making it a challenge to get a comprehensive view. Today, companies are able to examine thousands of information points on each customer to better understand and segment their best customers.

For example , companies have used big data to figure out how millennial buying habits differ from previous generations. In terms of a singular product, companies now understand why the product…

Read More on Dataflow

Categories
Big Data Data Analytics Data Enrichment

Where to Get Free Public Datasets for Data Analytics Experimentation

Many data companies believe that they have to create their own datasets in order to see the benefits of data analytics, but this is far from the truth. There are hundreds of thousands of free datasets on the internet that anyone can access completely free. These datasets can be useful for anyone who is looking to learn how to analyze data, create data visualizations, or just improve their data literacy skills.

Data.gov

In 2015, the United States Government pledged to make all government data available for free online. Data.gov allows you to search over 200 thousand datasets from a variety of sources and pertaining to many different topics. They offer datasets about Agriculture, Finances, Public Safety, Education, The Environment, Energy, and many other topics that span over a wide range of subjects.

Google Trends

With Google Trends, users are able to find search term data on any topic in the world. You can check how often people google your company, and you can even download the datasets for analysis in another program. Google offers a wide variety of filters, allowing you to narrow down your search by location, time ranges, categories, or even specific search types (ex. Image or video results).

Amazon Web Services Open Data Registry


Amazon offers just over 100 datasets for public use, covering a wide range of topics, such as an encyclopedia of DNA elements, Satellite data, and Trip data from Taxis and Limousines in New York City. Amazon also includes “usage examples” where they provide links to work that other organizations and groups have done with the data.

Data.gov.uk

Just like the United States, The United Kingdom posts all of their data for public use free of charge. This is also the case with lots of other countries such as Singapore, Australia, and India. With so many countries offering their data to the public, it shouldn’t be hard to find a good data set to experiment with.

Pew Internet

The Pew Research Center’s mission is to collect and analyze data from all over the world. They cover all sorts of topics like journalism, religion, politics, the economy, online privacy, social media, and demographic trends. They are nonprofit, nonpartisan and nonadvocacy. While they do their own work with the data they collect, they also offer it to the public for further analysis. To gain access to the data, all you need to do is register for a free account, and credit Pew Research Center as the source for the data.

Reddit Comments

reddit datasetsSome members of r/datasets on Reddit have released a dataset of all comments on the site dating back to 2005. The datasets are categorized by year and are available to download for free by anyone and it could be a fun project to analyze the data and see what could be discovered about reddit commenters.

Earthdata

Another great source for datasets is Earthdata, which is a part of NASA’s Earth Science Data Systems Program. Its purpose is to process and record Earth Science data from Aircraft, Satellites, and field measurements.

UNICEF

UNICEF’s data page is a great source for data sets that relate to nutrition, development, education, diseases, gender equality, immunization and other issues relating to women and children. They have about 40 datasets open to the public.

National Climatic Data Center

The National Climatic Data Center is the largest archive of environmental data in the world. Here you can find an archive of weather and climate data sets from all around the United States. The National Climatic Data Center also has meteorological, geophysical, atmospheric, and oceanic data sets.

Read More Here

Categories
Big Data Data Analytics

How to Increase Diversity in the Tech Workplace

Diversity in the workplace is something that all tech companies should strive for. When appropriately embraced in the technology sector, diversity has been shown to increase financial performance, increase employee retention, foster innovation, and help teams to develop better products. For example, data marketing teams that have equitable hiring practices in regards to gender exemplify this.

While the particular benefits of a diverse workplace can help any company thrive, figuring out how exactly to improve diversity within tech workplaces can be a challenge. However, employing the diverse team is not impossible, and the rewards make diversification efforts well worth it.

Diversity Is Less Common Than You Might Think

Though the tech industry will be far more diverse today than it has been in the past, diversity still remains an issue across the sector. Even if those heading tech companies don’t engage in outright racism by fostering a hostile work environment towards people of color or discouraging the hiring of diverse groups, many tech companies still find themselves with teams that look and think alike. Homogeny creates complacency, insulates a workforce from outside perspectives, and ultimately prevents real innovation plus creativity from taking place.

Tech companies can be complicit in racism through hiring practices, segregation of existing…

Read More on Dataflow

Categories
Big Data Data Analytics

An Analysis of Facebook’s Cryptocurrency Libra and What it Means for Our World

After months of speculation, Facebook has revealed its Libra blockchain and the Libra coin to the world. The highly-anticipated cryptocurrency ran into immediate opposition in Europe and the United States. The French Finance Minister Bruno Le Maire said it was “out associated with question” that Libra would “become a sovereign currency”. Meanwhile, Markus Ferber, the German member of the European Parliament, said that Libra has the potential to become a “shadow bank” and that regulators should be on high alert. In addition, both Democrats and Republicans raised their concerns with Representative Patrick McHenry, the senior Republican on the House Financial Services Committee, calling for a hearing on the initiative.

It was to be expected that when the particular social media giant, who has seen numerous scandals in 2018, would launch a cryptocurrency, there would be opposition. Many people, organisations and governments no longer trust Facebook with the social media data, let alone along with their financial information. The main concerns from regulators and lawmakers around the particular world are that Facebook is already too massive and careless with users’ privacy to launch an initiative like Libra.

However, before we judge too quickly, let’s first dive into the Libra blockchain as well as the Libra coin to understand it…

Read More on Dataflow

Polk County Schools Case Study in Data Analytics

We’ll send it to your inbox immediately!

Polk County Case Study for Data Analytics Inzata Platform in School Districts

Get Your Guide

We’ll send it to your inbox immediately!

Guide to Cleaning Data with Excel & Google Sheets Book Cover by Inzata COO Christopher Rafter