Categories
Big Data Data Preparation Data Quality

How to Solve Your Data Quality Problem

Why Does My Data Quality Matter?

One of the prime goals of most data scientists is to maintain the quality of data in their domains. Because business analytics tools rely on past data to make present decisions, it’s critical that this data is accurate. While it’s plenty easy to continually log information, you can risk creating data silos, large quantities of data that end up never really being utilized. 

Your data quality can directly impact whether and to what degree your company succeeds. Bad data can never be completely filtered, even with the best BI tools. The only way to base a future business decision on quality data is to only collect quality data in the first place. If you’re noticing that your company’s data could use a quality upgrade, it’s not too late!

What Are Some Common Mistakes Leading to Bad Data Quality?

By simply not engaging in a few practices, your company can drastically cut back on the volume of bad data you store. First, remember that you shouldn’t automatically trust the quality of data being generated by your current enterprise tool suite. This should be evaluated by professional data scientists to determine quality. Quite often, older tools generate more junk data than modern tools with better filtering technology.

Another common mistake is to allow different departments within your company to isolate their data away from the rest of the company. Of course, depending on the department and nature of your company, this could be a legal requirement. However, if not, you should ensure that there’s a free flow of data across business units. This can create an informal “checks and balances” system and help prevent those data silos from building or destroy existing ones.

How Can I Identify Bad Data?

Keeping in mind that, even with the best practices in place, it’s unrealistic to expect a total elimination of risk associated with bad data being collected. With the volume of enterprise tools in usage combined with even the most minor human error in data entry having the potential to create bad data, a small amount should be expected. That’s why it’s important to remain vigilant and regularly check for these items in your existing data and purge those entries if found:

  • Factually False Information – One of the more obvious examples of bad data is data that’s entirely false. Almost nothing could be worse to feed into your BI tools, making this the first category of bad data to remove if found.
  • Incomplete Data Entries – Underscoring the importance of mandating important database columns, incomplete data entries are commonly found in bad data. These are entries that cannot be fully interpreted without the information that’s missing being filled in.
  • Inconsistently Formatted Information – Fortunately, through the power of regular expressions, this type of bad data can often be solved fairly quickly by data scientists. A very common form of this is databases of telephone numbers. For example, even if all of the users are in the same country, different formats like (555) – 555-5555, 5555555555, 555-5555555, etc., are often present when any string is accepted as a value for the column.

What Can I Do Today About Bad Data?

It’s crucial that your company comes up with a viable, long-term strategy to rid your company of bad data. Of course, this is typically an intensive task and isn’t accomplished overnight. Most importantly, the removal of bad data isn’t simply a one-time task. It must be something that your data staff is continuously evaluating in order to stay in place and remain effective.

After an initial assessment of your company’s data processing practices and the volume of bad data you have, a professional firm can consult with your data team for technical strategies they can utilize in the future. By combining programmatic data input and output techniques with employee and company buy-in, no bad data problem is too out of control to squash.
Categories
Data Quality

The Five Ways Dirty Data Costs Businesses Money

Dirty data in their systems costs U.S. companies anywhere from $2.5 to $3.1 trillion each year. Errors and omissions in master data in particular are notorious for causing costly business interruptions. And there’s no insurance you can buy against dirty data. It’s a simple fact of life many businesses grudgingly live with, but barely acknowledge. Our goal in this piece is to help you understand the areas where Dirty Data causes profit leakages in businesses, how to recognize them, and a little on what you can do about them.

Here are five ways dirty data could be costing your business money….

1. Wrong Conclusions and Time Wasted

Stop me if you’ve heard this one before:

Analyst goes into a meeting with their first bright, shiny new dashboard from the new multi-million dollar Data Warehouse.

A few minutes in, one executive starts to notice an anomaly in the data being presented. Something doesn’t add up, so they pull up their system and check it. Yes, definitely a mismatch.

Smelling blood in the water, other employees start to pile on until the poor analyst is battered and beaten, all for just doing their job.

This scenario plays out every day in companies across the US when even slightly dirty data is unknowingly used for analytics. The way most businesses detect the problem is to run right smack into it.

Apart from this disastrous meeting, which has been a waste of time, the BI team might spend months debating their findings with a disbelieving business audience. The net result: lots of time wasted, incorrect conclusions from analysis, and eventually nobody really trusts the data.

2. Operational Interruption

Dirty data and operational mistakes go hand in hand to cost businesses trillions every year.

The address was wrong, so the package wasn’t delivered.
The payment was applied to the wrong duplicate account.
The callback never reached the client because the number was wrong.

On the bright side, operational errors due to bad data often get addressed first and often because they’re so visible. They are the squeaky wheel of the organization, and for good reason.

If you’re trying to improve operational efficiency, make sure you start with as clean data as possible. And protect your data to keep it clean. Don’t import records into your CRM until you’ve checked them. Your operation is a clean, pristine lake with a healthy eco-system. Dirty data is toxic pollution that will disrupt that natural harmony.

3. Missed Opportunities

In our opinion, this one is the costliest of all by far, but it flies below the radar since it’s rooted in opportunity cost; However, it really deserves far more attention.

When a company lapses into and accepts a culture of “We have dirty data”, lots of great ideas for new initiatives never get off the ground, which results in billions of dollars in missed commercial opportunity every year.

New business ideas and innovations for current practices are constantly shot down because “We don’t have that data.” Or “We have that data, but it’s only 50% accurate.” Even worse, sometimes these innovative new ventures proceed into the incubator stage with high startup costs, only to explode on the launchpad because the data can’t be trusted or turns out to be dirty.

4. Poor Customer Experience

Every executive will admit customers are the #1 priority. Customers are also, of course, real people. But to your front line sales and service reps – the ones actually interacting with customers by phone and email, the crucial link is the data your company holds about that customer.

Think about it, the outcome of every service call, product order, subscription purchase is based in large part on the data your company has on its customers. If that data is inconsistent across customers, or just downright dirty and inaccurate, bad things start to happen. Products ship out to the wrong address. The wrong products are recommended. Returns go to the wrong place. Sales calls go to old, disconnected numbers. Inaccurate bills go out, payments are applied incorrectly.

If your business is one with multiple departments and business lines, clients can start to feel pretty underappreciated when one department knows their birthday and children’s names, and another can barely look up their account number by last name.

5. Time Wasted Cleaning It Up

Cleaning up dirty data is the first step in eradicating it. But it is a terribly time consuming process, and often very manual. Cleaning dirty data that’s been neglected for years can take years itself and is tedious and costly. Appending and fixing contact information can cost as much as one dollar per record. The average cost to clean up one duplicate record ranges from $20-$100 with everything factored in. Cleaning up thousands of duplicates and incomplete rows must be done carefully to avoid compounding the errors.

The cleanup of dirty data starts with a good understanding of the root causes, which takes time to forensically analyze what went wrong and when. Cleaning up dirty data is one step in a larger process, but it has the potential to wreck everything and force you into a reset. Worse, there’s the very real possibility that the issues go undetected and somehow end up in a final work product. Rest assured that someone will read your work product and see what’s wrong with it.

Often what’s wrong with the data is not fully understood and some cleaning efforts actually make it worse. (Ever have a sort error on a table column get loaded back into production? Fun times.)

It’s best to position the cleaning of data early in your larger set of processes. This means planning out how data will be processed and understanding what can’t be properly digested by downstream databases, analytics packages and dashboards. While some problems, such as issues with minor punctuation marks, can be handled in post-processing, you shouldn’t assume this will happen. Always plan to clean data as early as possible.

Luckily, we are seeing new strides in Artificial Intelligence that make this process easier and reduce the time from years down to days and weeks.

Automated Data Profiling (https://qastaging.wpengine.com/products-data-analysis-tools/) can shave months off the “finding out what’s wrong” phase of a data cleanup, giving a statistical readout of each issue by category so the problems can be prioritized and addressed in the right order.

Automated Data Enrichment (https://qastaging.wpengine.com/products-data-analysis-tools/data-enrichment/)and data append help with deduplication and merging of duplicate records.

Finally, Automated Data Modeling (https://qastaging.wpengine.com/products-data-analysis-tools/aipowered-data-modeling-augmented-data-management/) helps to round out the view of key entities, resulting in a more consistent customer experience, for example.

Categories
Data Quality

Data Cleaning: Why it’s Taking Up Too Much Time

A major part of most data projects is making sure that the inputs have been properly cleaned. Poorly formatted input data can quickly lead to a cascade of problems. Worse, errors can go completely undetected if the faults in the data don’t lead to faults in the process.

On the flip side, data cleaning can end up eating up a lot of your time. It’s a good idea to think about why that is and how you might be able to remedy the issue.

Why Data Cleaning is So Time-Consuming

A big problem when it comes to fixing data up for use is that there are often mismatches between the source format and the format used by the system processing the information. Something as simple as dealing with the use of semicolons and quotes in a CSV file will still add to the time required to clean data for a project.

It’s hard to anticipate all the ways things can be wrong with source data. User-contributed data, for example, may not be highly curated. Rather than getting highly clean inputs, you may get all kinds of characters that have the potential to interfere with reading and processing.

Security features also can drive the need for data cleaning. Web-submitted data is often automatically scrubbed to prevent SQL injection attacks. While doing data cleaning, it’s often necessary to reverse this process to get at what the original inputs looked like.

Cultural differences can present major problems in cleaning data, too. Even simple things like postal codes can create trouble. A US ZIP code is always either a 5-digit input or 5 digits followed by a dash and four more digits. In Canada, postal costs use both letters and numbers, and there are spaces.

End-users of web applications often enter inputs regardless of whether they fit the database’s format. In the best scenario, the database software rejects the entry and alerts the user. There are also scenarios, though, where the input is accepted and ends up in a field that’s mangled, deprecated or just blank.

Considerations During Data Cleaning

A major question that has to be asked at the beginning of an effort is how much data can you afford to lose. For example, a dataset of fewer than 1,000 entries is already dangerously close to becoming statistically too small to yield relevant results. One way is to just toss out all the bad lines. If a quarter of the entries are visibly flawed and 10% more have machineability issues, it’s not long before you’re shaving off one-third of the dataset without even starting processing. Pre-processing may shave off even more data due to things like the removal of outliers and duplicates.

Barring extreme limits on time or capabilities, your goal should be to preserve as much of the original information as practicable. There are several ways to tackle the task, including doing:

  • Manual checks of the data to identify obvious problems
  • Dry runs of processing and post-processing work to see how mangled or accurate the output is
  • Standard pre-processing methods to spot common problems, such as unescaped or escaped characters and HTML entities
  • Machine learning work to recognize patterns in poorly formatted data

While it might be possible to acquire pre-cleaned data from vendors, you’ll still need to perform the same checks because you should never trust inputs that haven’t been checked.

Planning Ahead

Data cleaning is one step in a larger process, but it has the potential to wreck everything and force you into a reset. Worse, there’s the very real possibility that the issues go undetected and somehow end up in a final work product. Rest assured that someone will read your work product and see what’s wrong with it.

It’s best to position the cleaning of data early in your larger set of processes. This means planning out how data will be processed and understanding what can’t be properly digested by downstream databases, analytics packages and dashboards. While some problems, such as issues with minor punctuation marks, can be handled in post-processing, you shouldn’t assume this will happen. Always plan to clean data as early as possible.

With a structured process in place, you can operate with cleaner datasets. This will save time and money, and it will also reduce storage overhead. Most importantly, it will ensure you have the largest datasets possible to get the most relevant analysis that can be derived from it.

Categories
Big Data Data Quality

What is Data Cleaning?

What is Data Cleaning?

Lets face it, most data you’ll encounter is going to be dirty. Dirty data yields inaccurate results, and is worthless for analysis until it’s cleaned up. Data cleaning is the process of preparing data for analysis by removing or modifying data that is incorrect, incomplete, irrelevant, duplicated, or improperly formatted. There are several methods for data cleansing depending on how it is stored along with the answers being sought.

Data cleansing is not simply about erasing information to make space for new data, but rather finding a way to maximize a data set’s accuracy without necessarily deleting information.

Data cleansing is the process of spotting and correcting inaccurate data. Organizations rely on data for many things, but few actively address data quality. Whether it’s the integrity of customer addresses or ensuring invoice accuracy. Ensuring effective and reliable use of data can increase the intrinsic value of the brand.  Business enterprises must assign importance to data quality.

Since there are many different types of data quality issues, each one requires different tactics to clean them.  

For one, data cleansing includes more actions than removing data, such as fixing spelling and syntax errors, standardizing data sets, and correcting mistakes such as missing codes, empty fields, and identifying duplicate records. Data cleaning is considered a foundational element of data science basics, as it plays an important role in the analytical process and uncovering reliable answers.

Most importantly, the goal of data cleansing is to create datasets that are standardized and uniform to allow business intelligence and data analytics tools to easily access and find the right data for each query.

Why Clean Data?

A data driven marketing survey conducted by Tetra data found that 40% of marketers do not use data to its full effect. Managing and ensuring that the data is clean can provide significant business value.

Improving data quality through data cleaning can eliminate problems like expensive processing errors, manual troubleshooting, and incorrect invoices. Data quality is also a way of life because important data like customer information is always changing and evolving.

Business enterprises can achieve a wide range of benefits by cleansing data and managing quality which can lead to lowering operational costs and maximizing profits.

How To Clean Data

To be considered high-quality, data needs to pass a set of quality criteria. Those include:

  • Valid: The degree to which the measures conform to defined business rules or constraints. When modern database technology is used to design data-capture systems, validity is fairly easy to ensure: invalid data arises mainly in legacy contexts (where constraints were not implemented in software) or where inappropriate data-capture technology was used (e.g., spreadsheets, where it is very hard to limit what a user chooses to enter into a cell, if cell validation is not used). Data constraints fall into the following categories.
    • Data-Type Constraints – e.g., values in a particular column must be of a particular datatype, e.g., Boolean, numeric (integer or real), date, etc.
    • Range Constraints: typically, numbers or dates should fall within a certain range. That is, they have minimum and/or maximum permissible values.
    • Mandatory Constraints: Certain columns cannot be empty.
    • Unique Constraints: A field, or a combination of fields, must be unique across a dataset. For example, no two persons can have the same social security number.
    • Set-Membership constraints: The values for a column come from a set of discrete values or codes. For example, a person’s gender may be Female, Male or Unknown (not recorded).
    • Foreign-key constraints: This is the more general case of set membership. The set of values in a column is defined in a column of another table that contains unique values. For example, in a US taxpayer database, the “state” column is required to belong to one of the US’s defined states or territories: the set of permissible states/territories is recorded in a separate States table. The term foreign key is borrowed from relational database terminology.
    • Regular expression patterns: Occasionally, text fields will have to be validated this way. For example, phone numbers may be required to have the pattern (999) 999-9999.
    • Cross-field validation: Certain conditions that utilize multiple fields must hold. For example, in laboratory medicine, the sum of the components of the differential white blood cell count must be equal to 100 (since they are all percentages). In a hospital database, a patient’s date of discharge from hospital cannot be earlier than the date of admission.
    • Data cleaning to correct validity issues can often be done programmatically.
  • Accuracy: Quite simply, is the data right. The conformity of a measure to a standard or a true value. Accuracy is very hard to achieve through data cleaning in the general case, because it requires accessing an external source of data that contains the true value: such “gold standard” data is often unavailable. Accuracy has been achieved in some data cleansing contexts, notably customer contact data, by using external databases that match up zip codes to geographical locations (city and state), and also help verify that street addresses within these zip codes actually exist.
  • Completeness: The degree to which all required measures are known. Incompleteness is almost impossible to fix with data cleaning methodology: one cannot infer facts that were not captured when the data in question was initially recorded. In the case of systems that insist certain columns should not be empty, one may work around the problem by designating a value that indicates “unknown” or “missing”, but supplying of default values does not imply that the data has been made complete.
  • Consistency: The degree to which a set of measures are equivalent in across systems. Inconsistency occurs when two data items in the data set contradict each other: e.g., a customer is recorded in two different systems as having two different current addresses, and only one of them can be correct. Fixing inconsistency is not always possible: it requires a variety of strategies – e.g., deciding which data were recorded more recently, which data source is likely to be most reliable (the latter knowledge may be specific to a given organization), or simply trying to find the truth by testing both data items (e.g., calling up the customer).
  • Uniformity: The degree to which a set data measures are specified using the same units of measure in all systems. It is often quite easy to ensure this through data cleaning early in the process, but as the process moves along, and data is transformed and changed, it becomes far more difficult. In datasets pooled from different locales, weight may be recorded either in pounds or kilos, and must be converted to a single measure using an arithmetic transformation. This also points out the problem of naked metrics, where values like weight may be recorded as an integer value. Unless there is another column directly next to it, or a notation in the column heading, it can be next to impossible to determine whether a value is in kilos or pounds, or celsius or Fahrenheit.

The term integrity encompasses accuracy, consistency and some aspects of validation but is rarely used by itself in data-cleansing contexts because it is insufficiently specific.

How Can I Use Data Cleaning?

Regardless of the type of analysis or data visualizations you need, data cleansing is a vital step to ensure that the answers you generate are accurate. When collecting data from several streams and with manual input from users, information can carry mistakes, be incorrectly inputted, or have gaps.

Data cleaning helps ensure that information always matches the correct fields while making it easier for business intelligence tools to interact with data sets to find information more efficiently. One of the most common data cleaning examples is its application in data warehouses.

After cleansing, a data set should be consistent with other similar data sets in the system. The inconsistencies detected or removed may have been originally caused by user entry errors, by corruption in transmission or storage, or by different data dictionary definitions of similar entities in different stores. Data cleaning differs from data validation in that validation almost invariably means data is rejected from the system at entry and is performed at the time of entry, rather than on batches of data

A successful data warehouse stores a variety of data from disparate sources and optimizes it for analysis before any modeling is done. To do so, warehouse applications must parse through millions of incoming data points to make sure they’re accurate before they can be slotted into the right database, table, or other structure.

Organizations that collect data directly from consumers filling in surveys, questionnaires, and forms also use data cleaning extensively. In their cases, this includes checking that data was entered in the correct field, that it doesn’t feature invalid characters, and that there are no gaps in the information provided.

More on Data Cleaning:

https://en.wikipedia.org/wiki/Data_cleansing

https://searchdatamanagement.techtarget.com/definition/data-scrubbing

Categories
Business Intelligence Data Quality

The 3 Things You Need To Know If You Work With Data In Spreadsheets

Microsoft Excel and Google Sheets are the first choice of many users when it comes to working with data. They’re readily available, easy to learn and support universal file formats. When it comes to using a spreadsheet application like Excel or Google Sheets, the point is to present data in a neat, organized manner which is easy to comprehend. They’re also on nearly everyone’s desktop, and were probably the first data-centric software tool any of us learned.  Whether you’re using Excel or Google Sheets, you want your data cleaned and prepped. You want it accurate and consistent, and you want it to elegant, precise, and user-friendly.

But there is a downside. While spreadsheets are popular, they’re far from the perfect tool for working with data. We’re going to explore the Top 3 things you need to be aware of if you work with data in spreadsheets.

While spreadsheet tools are quite adequate for many small to mid-level data chores, there are some important risks to be aware of. Spreadsheets are desktop-class, file-oriented tools which means their entire data contents are stored in volatile RAM while in use and on disk while you’re not using them. That means that between saves, the data is stored in RAM, and can be lost.

Risk #1: Beware of Performance and Data Size Limits in Spreadsheet Tools

Most people don’t check the performance limits in Spreadsheet tools before they start working with them. That’s because the majority won’t run up against them. However, if you start to experience slow performance, it might be a good idea to refer to the limits below to measure where you are and make sure you don’t start stepping beyond them. Like I said above, spreadsheet tools are fine for most small data, which will suit the majority of users.

But at some point, if you keep working with larger and larger data, you’re going to run into some ugly performance limits. When it happens, it happens without warning and you hit the wall hard.

Excel Limits

Excel is limited to 1,048,576 rows by 16,384 columns in a single worksheet.

  • A 32-bit Excel environment is subject to 2 gigabytes (GB) of virtual address space, shared by Excel, the workbook, and add-ins that run in the same process.
  • 64-bit Excel is not subject to these limits and can consume as much memory as you can give it. A data model’s share of the address space might run up to 500 – 700 megabytes (MB), but could be less if other data models and add-ins are loaded.

Google Sheets Limits

  • Google Spreadsheets are limited to 5,000,000 cells, with a maximum of 256 columns per sheet. (Which means the rows limit can be as low as 19,231, if your file has a lot of columns!)
  • Uploaded files that are converted to the Google spreadsheets format can’t be larger than 20 MB and need to be under 400,000 cells and 256 columns per sheet.

In real-world experience, running on midrange hardware, Excel can begin to slow to an unusable state on data files as small as 50mb-100mb. Even if you have the patience to operate in this slow state, remember you are running at redline. Crashes and data loss are much more likely!

(If you’re among the millions of people who have experienced any of these, or believe you will be working with larger data, why not check out a tool like Inzata, designed to handle profiling and cleaning of larger datasets?)

Risk #2:  There’s a real chance you could lose all your work just from one mistake

Spreadsheet tools lack any auditing, change control, and meta-data features that would be available in a more sophisticated data cleaning tool. These features are designed to act as backstops for any unintended user error. Caution must be exercised when using them as multiple hours of work can be erased in a microsecond.

Accidental sorting and paste errors can also tarnish your hard work. Sort errors are incredibly difficult to spot. If you forget to include a critical column in the sort, you’ve just corrupted your entire dataset. If you’re lucky enough to catch it, you can undo it, if not, that dataset is now ruined, along with all of the work you just did. If the data saves to disk while in this state, it can be very hard, if not impossible, to undo the damage.

Risk #3:  Spreadsheets Aren’t Really Saving You Any Time

Spreadsheets are fine if you just have to clean or prep data once, but that is rarely the case. Data is always refreshing, new data is coming online. Spreadsheets lack any kind of repeatable processes and or intelligent automation.

If you spend 8 hours cleaning a data file one month, you’ll have to repeat nearly all of those steps the next time a refreshed data file comes along.

Spreadsheets can be pretty dumb sometimes. They lack the ability to learn. They rely 100% on human intelligence to tell them what to do, making them very labor intensive.

More purpose-designed tools like Inzata Analytics allow you to record and script your cleaning activities via automation. AI and Machine Learning lets these tools learn about your data over time. If you Data is also staged throughout the cleaning process, and rollbacks are instantaneous. You can set up data flows that automatically perform cleaning steps on new, incoming data. Basically, this lets you get out of the data cleaning business almost permanently.

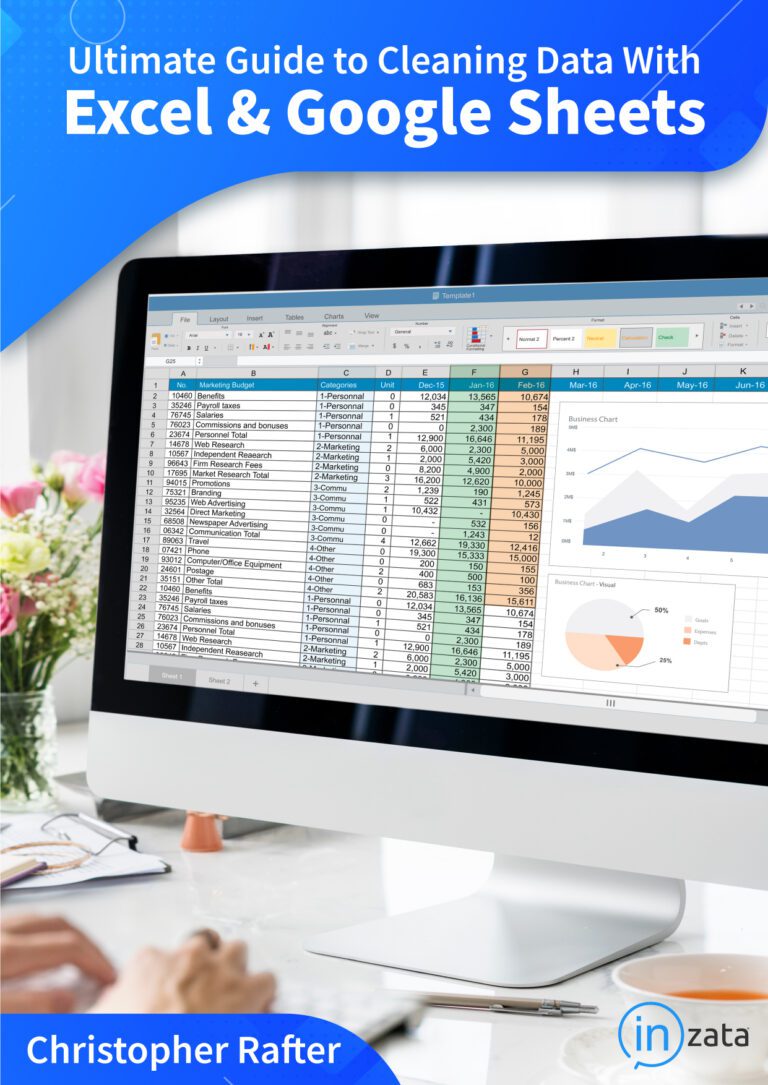
(Excerpt from The Ultimate Guide to Cleaning Data in Excel and Google Sheets)

Categories
Business Intelligence Data Quality

Chapter 3 – Cleaning Data with Excel and Google Sheets

How Spreadsheets Became The #1 BI Tool in the World

(Excerpt from The Ultimate Guide to Cleaning Data in Excel and Google Sheets)

Microsoft Excel and Google Sheets are the first choice of many users when it comes to handling large amounts of data. They’re readily available, easy to learn and support universal file formats. When it comes to using a spreadsheet application like Excel or Google Sheets, the point is to present data in a neat, organized manner which is easy to comprehend. They’re also on nearly everyone’s desktop, and were probably the first data-centric software tool any of us learned.

In this eBook, we are going to tell you some of the tips as to how to clean and prep up your data using Excel and Google Sheets, and make it accurate and consistent, and make it look elegant, precise, and user-friendly.

spreadsheet software

Risks of Cleaning Data In Spreadsheets

While spreadsheet tools are quite adequate for many small to mid-level data chores, there are some important risks to be aware of. Spreadsheets are desktop-class, file-oriented tools which means their entire data contents are stored in volatile RAM while in use and on disk while you’re not using them. That means that between saves, the data is stored in RAM, and can be lost.

Spreadsheet tools also lack any auditing, change control, and meta-data features that would be available in a more sophisticated data cleaning tool. These features act as backstops for any unintended user error. Caution must be exercised when using them as multiple hours of work can be erased in a microsecond.

Unnoticed sorting and paste errors can also tarnish your hard work. If the data saves to disk while in this state, it can be very hard, if not impossible, to undo the damage and revert to an earlier version.

Spreadsheets also lack repeatable processes and automation. If you spend 8 hours cleaning a data file one month, you’ll have to repeat nearly all of those steps the next time another refreshed data file comes along. More purpose-designed tools like Inzata Analytics allow you to record and script your cleaning activities via automation. Data is also staged throughout the cleaning process, and rollbacks are instantaneous. You can set up data flows that automatically perform cleaning steps on new, incoming data. Basically, this lets you get out of the data cleaning business almost permanently.

Performance and Size Limits in Spreadsheet Tools

Most folks don’t bother to check the performance limits in Spreadsheet tools before they start working with them. That’s because the majority won’t run up against them. However, if you start to experience slow performance, it might be a good idea to refer to the limits below to measure where you are and make sure you don’t start stepping beyond them. Like I said above, spreadsheet tools are fine for most small data, which will suit the majority of users.

Excel Limits

Excel is limited to 1,048,576 rows by 16,384 columns in a single worksheet.

  • A 32-bit Excel environment is subject to 2 gigabytes (GB) of virtual address space, shared by Excel, the workbook, and add-ins that run in the same process.
  • 64-bit Excel is not subject to these limits and can consume as much memory as you can give it. A data model’s share of the address space might run up to 500 – 700 megabytes (MB), but could be less if other data models and add-ins are loaded.

Google Sheets Limits

  • Google Spreadsheets are limited to 5,000,000 cells, with a maximum of 256 columns per sheet. (Which means the rows limit can be as low as 19,231, if your file has a lot of columns!)
  • Uploaded files that are converted to the Google spreadsheets format can’t be larger than 20 MB and need to be under 400,000 cells and 256 columns per sheet.

In real-world experience, running on midrange hardware, Excel can begin to slow to an unusable state on data files as small as 50mb-100mb. Even if you have the patience to operate in this slow state, remember you are running at redline. Crashes and data loss are much more likely!

If you believe you will be working with larger data, why not check out a tool like Inzata, designed to handle profiling and cleaning of larger datasets?

(Excerpt from The Ultimate Guide to Cleaning Data in Excel and Google Sheets)

Categories
Data Quality

Ebook Excerpt: Chapter 2 – Why Clean Data?

Chapter 2: Why Clean Data?

(Excerpt from The Ultimate Guide to Cleaning Data in Excel and Google Sheets)

Data cleansing is the process of spotting and correcting inaccurate data. Organizations rely on data for many things, but few actively address data quality. Whether it’s the integrity of customer addresses or ensuring invoice accuracy. Ensuring effective and reliable use of data can increase the intrinsic value of the brand.  Business enterprises must assign importance to data quality.

A data-driven marketing survey conducted by Tetra data found that 40% of marketers do not use data to its full effect. Managing and ensuring that the data is clean can provide significant business value.

Improving data quality can eliminate problems like expensive processing errors, manual troubleshooting, and incorrect invoices. Data quality is also a way of life because important data like customer information is always changing and evolving.

Business enterprises can achieve a wide range of benefits by cleansing data and managing quality which can lead to lowering operational costs and maximizing profits.

Who are the heroes who allow the organization to seize and enjoy all these benefits? I affectionately refer to these poor souls as PWCD’s, or People Who Clean Data[1].

These brave people, and hopefully you are reading this because you hope to be one of them, are the noblest. They often get little recognition even though they clean up the messes of hundreds, if not thousands of other people every day. They are the noble janitors of the data world. And I salute them.

Top 5 Benefits of Data Cleaning

1.  Improve the Efficiency of Customer Acquisition Activities

Business enterprises can significantly boost their customer acquisition and retention efforts by cleansing their data regularly. With the high throughput of the prospecting and lead process, filtering, cleansing, enriching having accurate data is essential to its effectiveness. Throughout the marketing process, enterprises must ensure that the data is clean, up-to-date and accurate by regularly following data quality routines. Clean data can also ensure the highest returns on email or postal campaigns as chances of encountering outdated addresses or missed deliveries are very low. Multi-channel customer data can also be managed seamlessly which provides the enterprise with an opportunity to carry out successful marketing campaigns in the future as they would be aware of the methods to effectively reach out to their target audience.

2.  Improve Decision-Making Processes

The cornerstone of effective decision making in a business enterprise is data. According to Sirius Decisions, data in an average B2B organization doubles every 12-18 months and though the data might be clean initially, errors can creep in at any time. In fact, in nearly all businesses where data quality is not managed, data quality decay is constantly at work. Each time new records are added; duplicates may be created. Things happening outside your organization, like customers moving and changing emails and telephone numbers will, over time, degrade data quality.

Yet the majority of enterprises fail to prioritize data quality management, or even acknowledge they have a problem! In fact, many of them don’t even have a record of the last time quality control was performed on their customer’s data. More often than not they merely discard or ignore data they believe to be of poor quality, and make decisions through other means. Here you can see that data quality is a massive barrier toward digital transformation and business intelligence, much less every company’s desire to become more Data-Driven.

Accurate information and quality data are essential to decision making. Clean data can support better analytics as well as all-round business intelligence which can facilitate better decision making and execution. In the end, having accurate data can help business enterprises make better decisions which will contribute to the success of the business in the long run.

3.  Streamline Business Practices

Eradicating duplicate and erroneous data can help business enterprises to streamline business practices and avoid wasteful spending. Data cleansing can also help in determining if particular job descriptions within the enterprise can be changed or if those positions can be integrated somewhere else. If reliable and accurate sales information is available, the performance of a product or a service in the market can be easily assessed.

Data cleansing along with the right analytics can also help the enterprise to identify an opportunity to launch new products or services into the market at the right time. It can highlight various marketing avenues that the enterprises can try. In practically any other business process you can name, decisions are made every day, some large, but many small. It is this systematic pushing of high-quality information down the chain of command, into the hands of individual contributors that helps them improve decisions made at all levels of the organization. Called Operational Intelligence, it is used more commonly for quick lookups and to inform the thousands of decisions that are made every day inside the organization.

4.  Increase Productivity

Having a clean and properly maintained enterprise dataset can help organizations ensure that the employees are making the best use of their time and resources. It can also prevent the staff of the enterprise from contacting customers with out-of-date information or create invalid vendor files in the system by conveniently helping them to work with clean records thereby maximizing the staff’s efficiency and productivity. High-quality data helps reduce the risk of fraud, ensuring the staff has access to accurate vendor or customer data when payments or refunds are initiated.

5.  Increase Revenue

Business enterprises that work on improving the consistency and increasing the accuracy of their data can drastically improve their response rates which results in increased revenue. Clean data can help business enterprises to significantly reduce the number of returned mails. If there are any time-sensitive information or promotions that the enterprise wants to convey to their customers directly, accurate information can help in reaching the customers conveniently and quickly.

Duplicate data is another aspect which can be effectively eradicated by data cleansing. According to Sirius Decisions, the financial impact of duplicate data is directly proportional to the time that it remains in the database.

Duplicate data can significantly drain the enterprise’s resources as they will have to spend twice as much on a single customer. For example, if multiple mails are sent to the same customer, they might get annoyed and might completely lose interest in the enterprise’s products and services.

[1] “People with Crappy Data” is an alternate interpretation coined by some of my clients.

Categories
Big Data Data Analytics Data Quality

What You Need to Know About Monetizing Healthcare Data

Healthcare services providers generate huge amounts of data in the course of any given year. Many organizations, though, see this work as a source of financial losses. In a more modern view of the situation, however, all this healthcare data maintenance can be seen as a potential way to decrease losses and to create profit centers. Let’s explore some of the ways data monetization can benefit a business in the healthcare industry.

Ethical and Legal Concerns with Data Monetization

HIPAA is, rightly, the dominant issue when dealing with the legality of any monetization effort, but not as much as one might think. Bear in mind that anonymization, when performed competently, does cover the confidentiality issues related to HIPAA.

The more concerning problem is on the ethical side of the equation. In particular, efforts to anonymize data need to focus on ensuring identifying factors, such as addresses, Social Security numbers and even uniquely assigned identifiers aren’t traceable to any one patient. This can be surprisingly challenging, as evidenced by work from MIT researchers that found anonymized datasets could be mapped to individuals based on location data and networks.

When setting up data sets, you definitely want to discuss these worries in detail with the parties handling them. Other stakeholders, including doctors, patients and your organization’s lawyers should be included in the process.

One solution worth considering is asking patients to opt in to information sharing. This requires creating a framework that guarantees the confidentiality of the data, and there also needs to be legal language that explains patients’ rights in detail. Such documents should always include an opt-in process that requires a patient to clearly indicate their interest and to provide their consent. This is absolutely essential if you’re going to be monetizing data by selling to third parties.

Reducing Losses

Much of the low-hanging fruit in the industry comes from situations where data analysis can provide insights regarding losses. In the simplest form, this comes from streamlining processes, such as:

  • Scheduling appointments between doctors and patients more efficiently
  • Avoiding duplication of medical efforts
  • Preventing potential slip-ups
  • Maintaining contact with patients about screenings and check-ups

There’s also another level at which healthcare data can be utilized to spur the well being of patients. For example, insurance carriers and hospitals mining patient data have discovered trends among their customers where preventive measures can be taken. By providing those customers with medical devices, preventative screenings and other forms of care, they’ve reduced costs by avoiding more expensive, radical and reactionary solutions.

Healthcare data can also be utilized to establish the efficacy of medical options. Rather than relying on old habits and tried-and-true solutions, professionals can utilize large-scale to develop insights about which drugs produce the best outcomes for the dollar. Data is also employed in researching:

  • Genomic and epigenetic concerns
  • Pharmacology studies
  • New drug discoveries and treatments

Developing Healthcare Data Profit Centers

While HIPAA rules limit the amount of specific data that can be sold in relation to patient care, anonymized data is still a strong potential profit center. Researchers, insurance companies, government agencies and marketers are all looking for information that can fuel their own data analysis. This sort of data can benefit groups that are trying to develop:

  • Economic models
  • Government policies
  • Metastudies
  • Information regarding rare disease
  • Trend analysis

Packaging data for third parties carries with it several concerns that need to be taken seriously. Foremost, it’s important that all patient data be scrubbed of any identifying features. Secondly, large banks of data become targets for hackers, and it’s important to secure all your systems. Thirdly, aggregation of anonymous data will likely demand some investment in bringing in qualified data scientists, establishing in-house standards and building out computing resources.

There is also the cultural component that comes with all efforts to become more data-centric. Stakeholders need to be brought in on monetization efforts, and it’s critical to confirm they are on board with the technical, cultural, legal and ethical requirements of the process. While you don’t want to clear out folks who have honest objections, there usually are situations where stakeholders have to be bought out of contracts or given severance packages. Your goal during a monetization push should be to develop a larger organizational commitment to doing it well.

A commitment to data and monetization takes time. Resources and talent have to be accumulated, and data often has to be prepped for outside consumption. This means taking into account data consumers’ concerns about data lineage, unique identifiers and other information that allows them to do their job well. Being able to present both internal stakeholders and third parties with finished products can make offerings significantly more appealing.

Plenty of thought goes into monetizing data from a healthcare organization. In time, though, a portion of your business that seems like it costs you money can end up curtailing losses and generating new sources of revenue.

Read more similar content here

Categories
Big Data Data Analytics Data Quality

What is Data Lineage & Why is it Important?

In the world of data analytics in 2019, keeping tabs on where bits of information came from, how they were processed and where they ended up at is more important than ever. This concept is boiled down to two words: data lineage. Just as a dog breeder would want to the lineage of a pooch they’re paying for, folks in the business intelligence sector want to know the lineage of the data that shows up in a final work product. Let’s look at the what, the why and the how of this process.

What is Data Lineage?

The simplest form of lineage for data is indexing items with unique keys that follow them everywhere. From the moment a piece of data is entered into a system, it should be tagged with a unique identifier that will follow it through every process it’s subjected to. This will ensure that all data points can be tracked across departments, systems and even data centers.

The concept can be extended significantly. Meta-data about entries can include information regarding:

  • Original publication dates
  • Names of authors
  • Copyright attributions
  • The date of the original entry
  • Any subsequently dates when it was accessed or modified
  • Parties that accessed or modified the data
  • Analytics methods that were used to process the data

In other words, the lineage functions as a pedigree that allows anyone looking at it to evaluate where it came from and how it got where it is today.

Why Does This Matter?

Within the context of business intelligence, there will always be questions about the inputs that went into a final product. Individual data points can be reviewed to discover problems with processes or to show how transformations occurred. This allows folks to:

  • Perform quality control on both the data and analytics techniques
  • Explain how particular insights were arrived at
  • Consider alternative approaches
  • Refine techniques
  • Mine older sources of data using new technologies

When someone wants to pull a specific anecdote from the data, the lineage allows them to get very granular, too. In the NBA of 2019, for example, shot location data is used to study players, set defenses and even choose when and where to shoot. If a coach wants to cite an example, they can look through the lineage for a shot in order to find film to pull up.

The same logic applies in many business use cases. An insurance company may be trying to find ways to deal with specific kinds of claims. No amount of data in the world is going to have the narrative power of a particular anecdote. In presenting insights, data scientists can enhance their presentations by honing in on a handful of data points that really highlight the ideas they’re trying to convey. This might include:

  • Providing quotes from adjuster’s reports
  • Comparing specifics of an incident to more generalized insights
  • Showing how the numbers align
  • Talking about what still needs to be studied

Data governance is also becoming a bigger deal with each passing year. Questions about privacy and anonymization can be answered based on the lineage of a company’s data. Knowing what the entire life cycle of a piece of information is ultimately enhances trust both within an organization and with the larger public.

Cost savings may be discovered along the way, too. Verification can be sped up by having a good lineage already available. Errors like duplication are more likely to be discovered and to be found sooner, ultimately improving both the quality and speed of a process. If a data set is outdated, it will be more evident based on its lineage.

The How

Talking about data lineage in the abstract is one thing. Implementing sensible and practical policies is another.

Just as data analytics demands a number of particular cultural changes within an organization, caring about lineage takes that one step further. It entails being able to:

  • Document where all the company’s data came from
  • Account for who has used it and how
  • Explain why certain use cases were explored
  • Vouch for the governance of the data with a high level of confidence

At a technical level, databases have to be configured to make tracking lineage possible. Data architecture takes on new meaning under these circumstances, and systems have to be designed from the start with lineage in mind. This can often be a major undertaking when confronting banks of older data. If it’s implemented in the acquisition and use of new data, though, it can save a ton of headaches.

Conclusion

Tracking the lineage of a company’s data allows it to handle a wide array of tasks more professionally and competently. This is especially the case when pulling data from outsides sources, particularly when paying for third-party data. Not only is caring about lineage the right thing to do, but it also has a strong business case to back it up.

READ MORE HERE

Categories
Data Analytics Data Quality Data Science Careers

I’m Outta Here: The Top Frustrations of a BI Engineer

The statements below first appeared in the r/BusinessIntelligence subreddit.

I have been working as a BI Developer/Consultant for the past 5 years after graduating from University. Many people are thinking about a career in this field. I thought I would offer my perspective of the problems I have faced and what led to my decision to move away from BI. Would love to hear any opinions/advice from others.

The first point I want to raise is that things have changed A LOT in BI/Data jobs over the past 5 years and not for the better. The job does not carry the same level of respect or ‘perceived’ value in an organization. Before you all murder me, let me explain. Data has more value than ever, I agree. However, the people who extract, clean, combine and deliver this data have much lower value. I am not sure why this has developed.


Advantages of BI/Data Careers

Job title of BI sounds fancy to most people. Salary ramp-up to mid level ($80k) on par or better than other IT/Business fields. (BI does cap out much earlier than other fields).

Easy to get into a low workload job as a Excel/PowerBI/Tableau data cruncher with a mid-level salary. Progress after that is very hard unless you make shifts to other areas.

Disadvantages of BI/Data Careers

Work that nobody wants to do gets dumped into the BI department. Its role is less well defined and it’s easy to sneak the mistakes of others into “the data department.” There’s no systematic way of managing the quality of what arrives in. Once we’ve taken custody of it and a few days have passed, it’s our problem. As if somehow 7,000 emails got turned into NULL in the 2 days since you sent me your file.

I once worked with a client that ran a yearly survey to gather data. They produced a report of top 100 companies and industry trends. Nobody in the client’s company wanted to sift through over 10,000 survey responses. Nobody wanted to clean data, extract insights from survey responses. So they just sent it.

This entire workload fell to us. the external consulting company, even with our $150-per-hour bill rate. It took us weeks of work and the company paid out quite a bit. Of course, remember I did not see $150-per-hour for this work, I just received my salary, which was in the $60k range. So who benefited and who overpaid?

Another example, this time from a large enterprise. Daily data loads extract data from [HR, finance, payroll, etc.] systems. New employees are sometimes set up with different/wrong values in different systems. This causes major issues in reporting/BI tools. Senior Management was quick to blame BI. They didn’t consider the inefficient processes, or mistakes at the operational level that led to this. The HR/Finance analysts don’t care about these issues. It got so bad, eventually setting up new employees in the HR system fell to BI analysts. They main reason was that they cared the most about the data.

The end users look at the data once a month if at all. The weekly emailed static reports often go unread. Instead the end users revert back to the prior solution where data is sourced by BI analysts manually. Guess what the reason was? End users find it boring to have to use cubes to browse data or PowerBI/Tableau to manipulate data. They prefer to file a request with the BI team and let them do that work, or have analysts send them a weekly email. Or simply sit in a meeting where someone else tells them what’s going on.

Salary cap to what BI developers can earn. I find that as a BI developer, my salary peaks at around 80% of what other types of developers earn at upper levels. Market rate for me is 90-100K (USD) in house and 100-120K (USD) consulting.

This is made worse by the number of senior SQL server/DBA/BI consultants (+20 experience) in the market. You don’t need more than 3/4 years experience with a BI toolset to get the job done properly. Yet I have been on many projects where clients have asked for someone with 12+ years experience. They’re later surprised when they learn someone with 4 years experience did the projects.

Job tied to a tool/industry. I was never sure why this matters so much. The ability to learn a new tool to get the job done is under-appreciated. I have worked in finance/retail/media and government BI. But I have been told I am not skilled enough to work in x industry or with y tool that varies slightly. Add to this jobs where I see people with masters or PhD level education doing BI Analyst work. People are on-average under-utilized, in my opinion.

BI testing. The most boring, manual, but most necessary part of any BI project.

Testing SQL business logic is painful because of the lack of automated testing solutions used across companies .

Testing with popular tools (PowerBI, Tableau) is nearly always manual . (Good luck testing complex finance dashboards with complex DAX business logic.)

Source system testing is non-existent. (What happens if you change the time zone in a source finance application. Does all the data for the user we extract change at a DB level as well?)

ETL testing (good luck testing 100+ SSIS packages).

Data Warehouse testing: all too often, complex business logic is piled on top of existing logic due to source system upgrades. cube/dashboard testing. No automated solutions exist. Mainly manual.

It’s rare to find business users who will agree to do testing properly. I have seen business users resign from jobs rather than sit and test large amounts of data manually.

While a career in BI is still very attractive to knowledge workers, I wanted to share the pitfalls. I hope my experience helps others. The space still has some maturing to do. If you get with the right organization, it can still be a great career. If they let you use the right data analysis tools, it can still be a win. The key is being able to quickly understand the environment and make quick decisions.

As an employee, you should be watchful for this, but you do have some choices . As a consultant – as I was/am – you’ll often get dragged into some of the worst environments to help fix things.

Expect that.

One can easily find themselves stuck cleaning data in Google Sheets for most of each day. It’s important to recognize the signs and signals of a good BI vs. a bad BI environment. My advice: look for places where business users are actively involved in BI projects. Companies that invest in their data, and in advanced AI tools. Places where they actually care about the outcome and respect the work you do. Because it’s important. You’re important.

Good luck out there.

The statements above first appeared in the r/BusinessIntelligence subreddit.


Polk County Schools Case Study in Data Analytics

We’ll send it to your inbox immediately!

Polk County Case Study for Data Analytics Inzata Platform in School Districts

Get Your Guide

We’ll send it to your inbox immediately!

Guide to Cleaning Data with Excel & Google Sheets Book Cover by Inzata COO Christopher Rafter